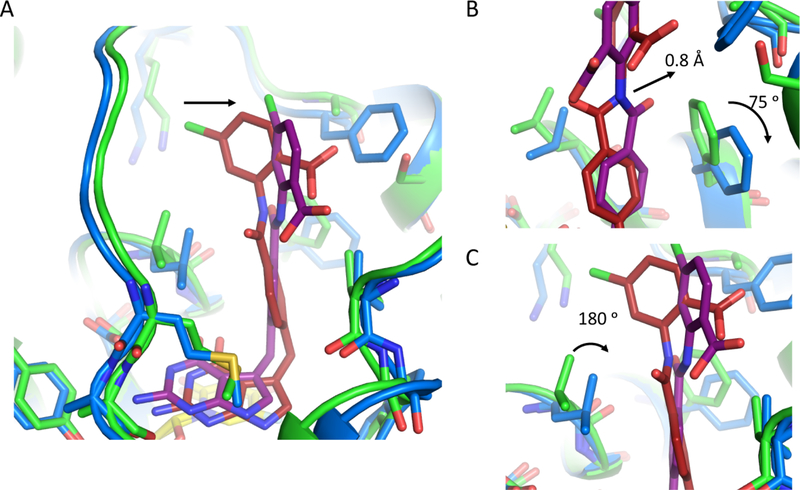
Figure 10.
Comparison of hTS bound to 14 (blue/dark red) and ChTS bound to 14 (green/purple) with dUMP (yellow) (PDB: 6PF8, and 6PF3). A. Comparison of 14 bound in hTS and ChTS active site. B. Zoom in view hTS residue F225 and ChTS residue F433 position upon binding 14. C. Zoom in view hTS residue L221 and ChTS residue L429 position upon binding 14.

