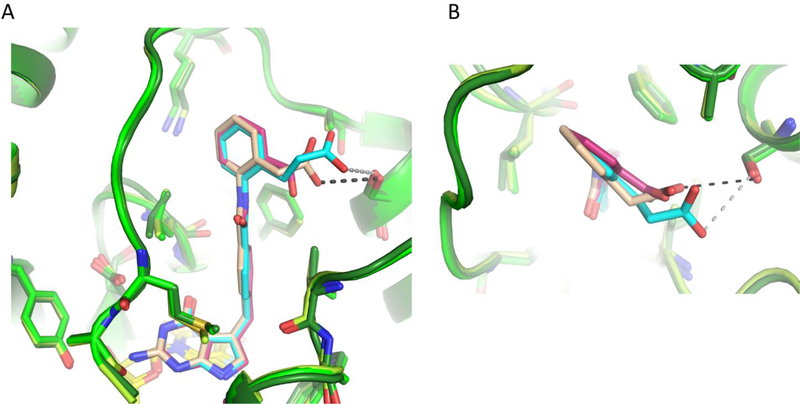
Figure 7.
Comparison of ChTS bound to 2 (light green/warm pink), ChTS bound to 5 (green/tan) and ChTS bound to 6 (dark green/cyan) with dUMP (yellow) (PDB: 6PF7, 6PF9, and 6PFB). A. Comparison of 2, 5, and 6 bound in ChTS active site, hydrogen bonds to 5 in black and to 6 in gray. B. Top view of benzoic acid, 2-phenylacetic acid, and 3-phenylpropanoic acid moiety for 2, 5, and 6, respectively.

