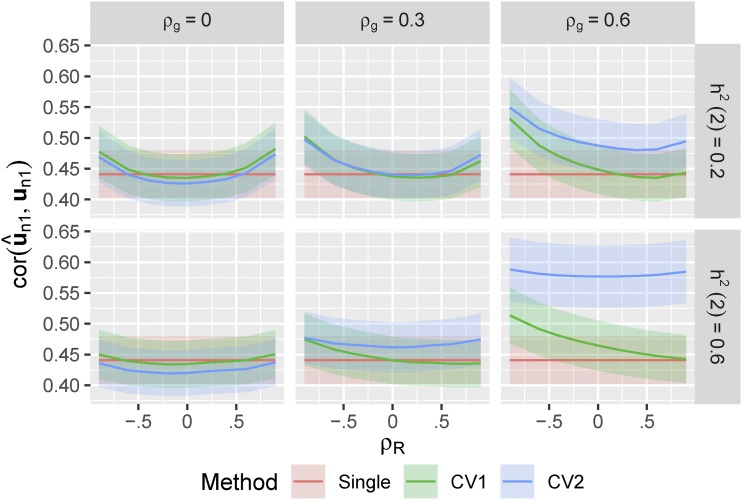
Figure 1.
True prediction accuracy of single-trait and multi-trait prediction methods in simulated data. 500 simulations were run for each heritability of the secondary trait (), and each combination of genetic and non-genetic correlation between the two traits (), all with . For each simulation, we used 90% of the individuals as training to fit linear mixed models (either single or multi-trait), predicted the genetic values of the remaining validation individuals, and then measured the Pearson’s correlation between the predicted () and true () genetic values. In the CV1 method, we used only information on the training individuals to calculate . In the CV2 method, we used the training individuals to calculate and combined this with the observed phenotypes for the secondary trait on the validation individuals (). Curves show the average correlation for each method across the 500 simulations. Ribbons show over the 500 simulations.

