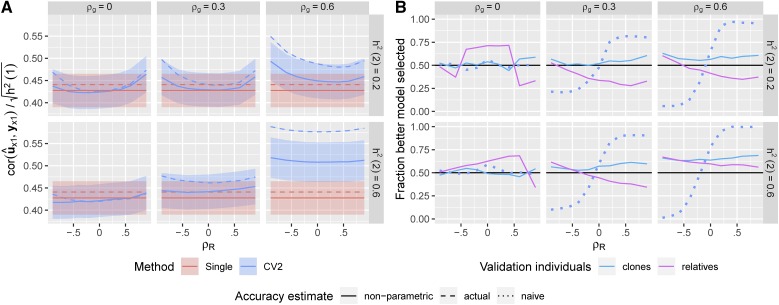
Figure 6.
Non-parametric CV* accuracy estimates. Estimated prediction accuracies and model selection accuracies based on the phenotypic values of close relatives. (A) Solid curves: Estimated prediction accuracies of the CV2-style and Single-trait methods evaluated against using clones. Dashed curves: True prediction accuracies of each method. Ribbons show over the 500 simulations. (B) Solid curves: Fraction of the 500 simulations in which the better method (between CV2 and single-trait) for predicting the true genetic values was correctly selected based on the phenotypes of relatives of the testing individuals. Dotted curve: Fraction of correct models selected based on the naive estimator.

