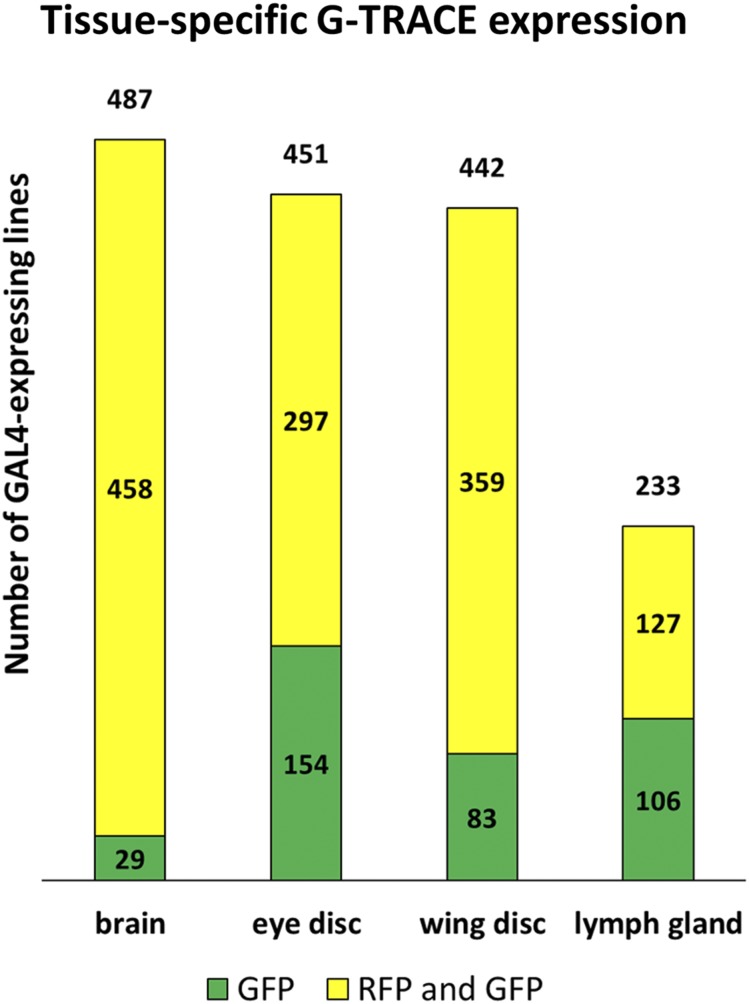
Figure 2.
Incidence of GAL4 activity within the larval brain, eye and wing imaginal discs, and lymph gland. Bar graphs demonstrating the total number of GAL4-expressing lines identified per tissue (number above the bar, out of 563 screened) as well as the subset exhibiting either combined RFP and GFP expression (yellow) or GFP expression alone (green).

