Figure 2.
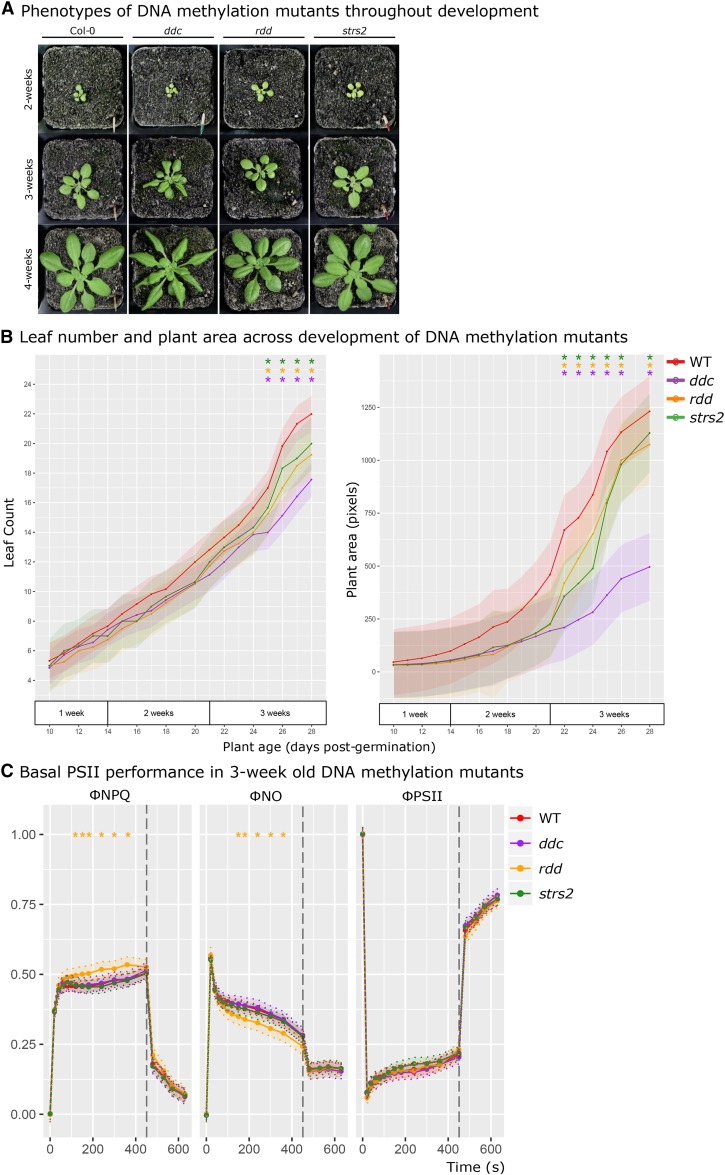
DNA methylation mutant development and basal PSII function A Representative morphology of WT, ddc, rdd, and strs2 from 2-4 weeks of age. B Leaf number (left) and plant area (right) in 10-day old WT (red, n = 8), ddc (purple, n = 8), rdd (orange, n = 8), and strs2 (green, n = 8) seedlings, monitored for 20 days until 4-weeks of age. C Measures of PSII performance in 3-week old WT (red, n = 60), ddc (purple, n = 10), rdd (orange, n = 10), strs2 (green, n = 15) plants grown under standard conditions. Points denote estimated marginal means based on a fitted linear mixed-effect model for each genotype. Bars and shaded regions denote 95% confidence intervals; * indicates statistical significance (adjusted p-value < 0.05) from WT.

