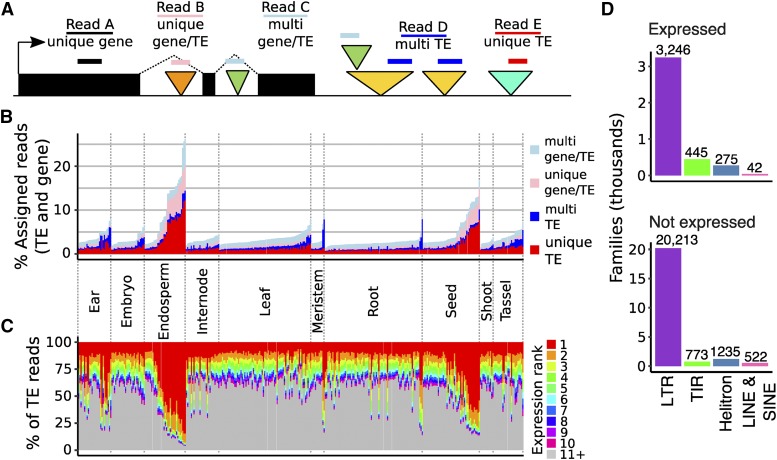
Figure 1.
Assessment of expressed TE families in B73. A. Schematic representation of reads assigned to genes or TEs in four categories. The black boxes represent exons of a gene while the colored triangles indicate TEs. Triangles of the same color represent different TEs that are members of the same family. The colored lines represent aligned RNAseq reads. B. For each library, the percent of assigned reads (to TEs or genes) that are assigned to TEs in each of the four categories is shown, with libraries labeled by tissue type and ordered within each tissue by TE contribution. C. The percent of TE reads (unambiguous unique or multi) assigned to the top 10 most highly expressed families, with libraries ordered as in B, demonstrating that much of the variation in total TE contribution across libraries results from expression of the top few families. D. The TE orders for TE families expressed or not expressed in B73 is shown. Less than 15% of all TE families have transcripts.

