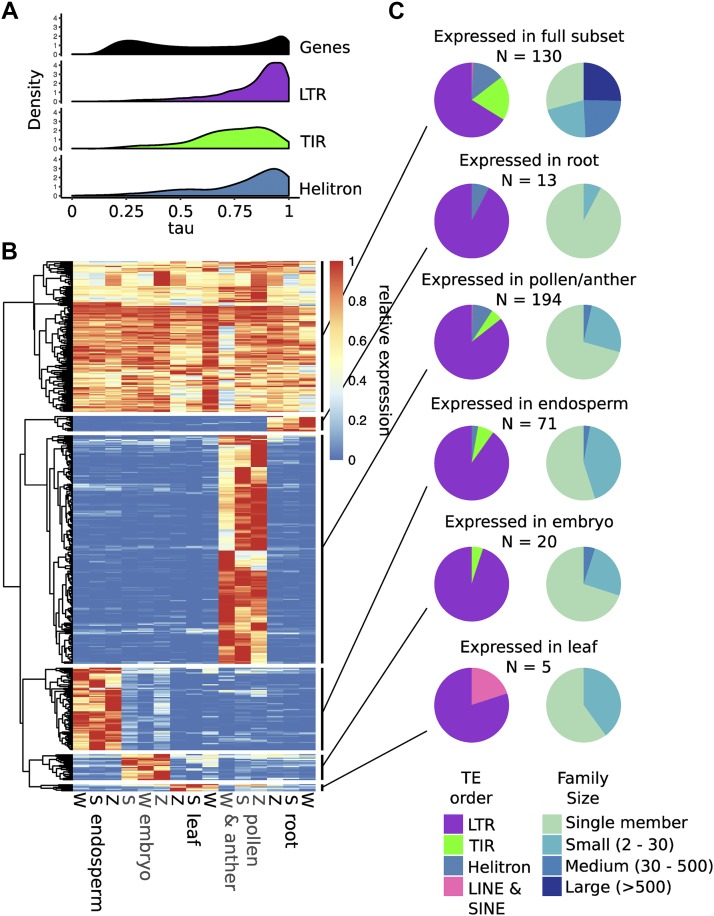
Figure 2.
Dynamic transcript abundance for TE families. A. The tissue-specificity of gene and TE transcript abundance was estimated with the tau metric, where low values indicate constitutive expression and high values indicate tissue-specific expression. B. Heat map showing the transcript abundance of TE families that are expressed across the developmental subset or expressed specifically in one tissue type. Transcript abundance is normalized by row. Columns are labeled by dataset (S = Stelpflug et al. 2016, W = Walley et al. 2016, Z = Zhou et al. 2019). C. The TE families in each group are broken down by TE order (left) and family size (right), showing differences between tissue-specific and constitutive groups.

