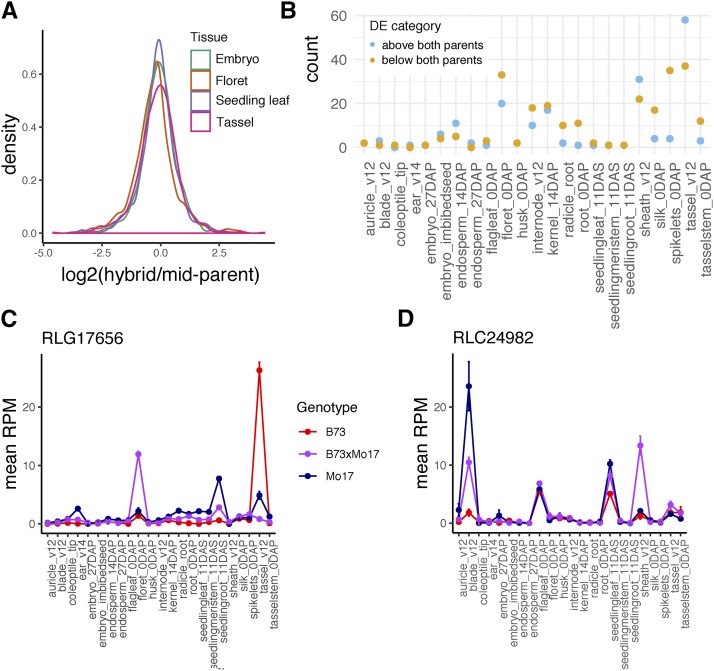
Figure 5.
TE expression dynamics in maize hybrids. A. For TE families that are differentially expressed between B73 and Mo17 in four tissues, the distribution of hybrid expression values divided by the mean of the parental values is shown. B. TE families showing non-additive expression in each tissue, defined by the hybrid expressed higher or lower than both inbred parents. The amount of non-additive expression varies across tissues, with the highest counts in reproductive tissues. C-D. Expression profiles of two example LTR families where non-additive expression is restricted to a single tissue.

