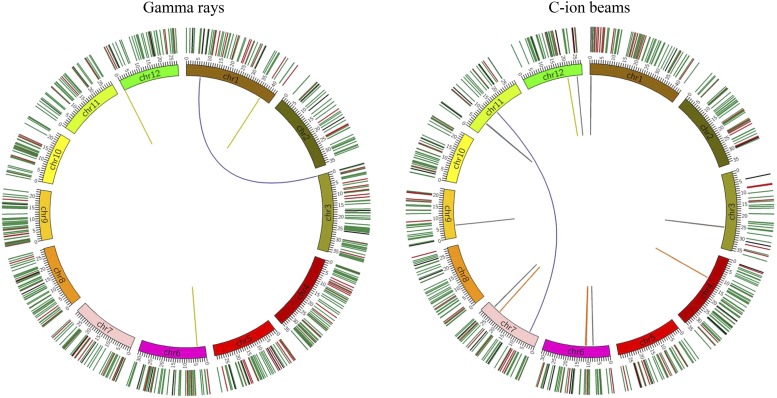
Figure 1.
Circos diagrams illustrating differences between gamma ray- and C ion-induced mutations. All of the mutations in the seven mutants produced by gamma-ray and C-ion irradiation are plotted in the left and right diagrams, respectively. The structural variations (SVs) are plotted as lines into the interior of the circles. Orange, purple, gray, yellow and blue represent inversion, reciprocal translocation, large deletion (≥100 bp), large insertion (≥100 bp), and duplication, respectively. Small mutations are indicated by short lines on the exterior of the circles. Green, red and black represent single base substitutions (SBSs), small deletions (<100 bp), and small insertions (<100 bp), respectively.

