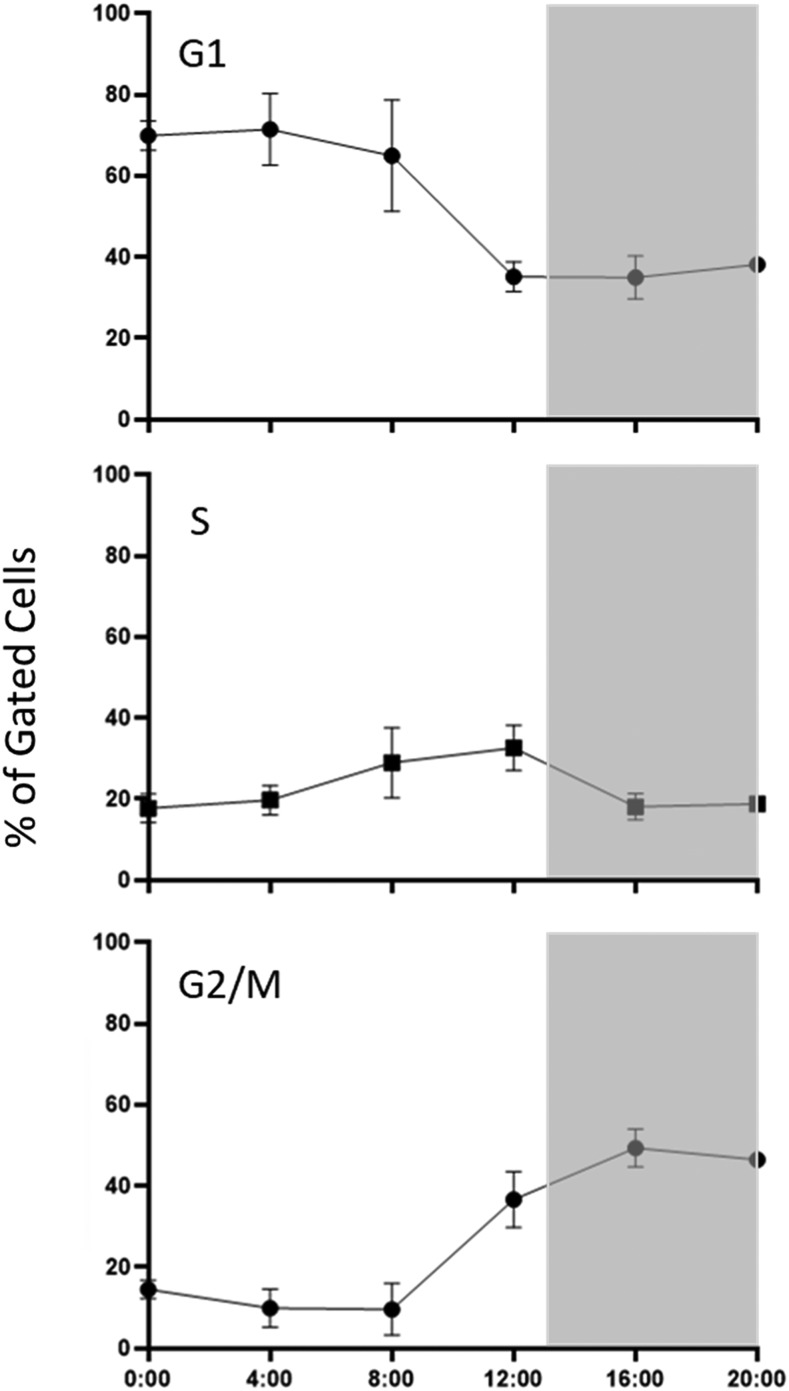
Figure 1.
Cell cycle distribution of free-living B. minutum over 24 h. Four cultures of B. minutum maintained on a diurnal cycle were sampled every 4 h. Cells were stained with propidium iodide and nuclear content was assessed by flow cytometry. Data were analyzed using the FlowJo Cell Cycle platform and plotted as the average percentage of gated cells in each cell cycle phase ± SD. Gray background represents periods of darkness.

