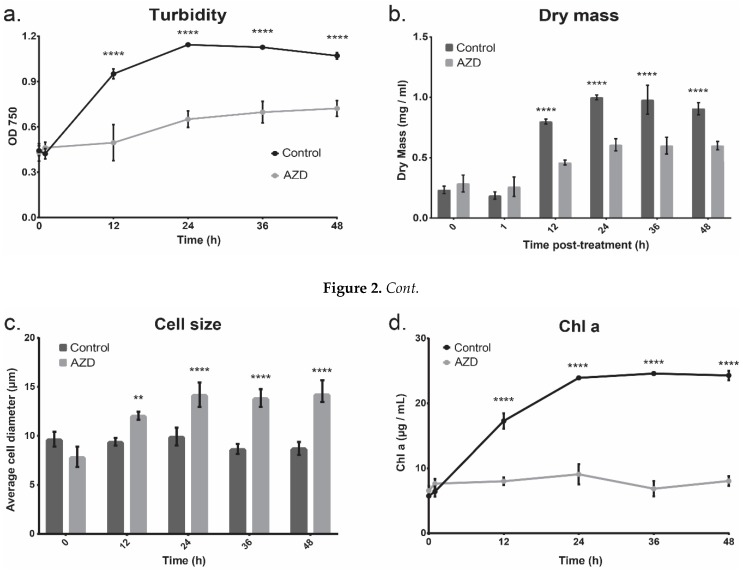
Figure 2.
The growth curves of cultures with and without AZD8055 exposure. The error bars represent standard deviation and statistical differences indicate a difference between the inhibited and non-inhibited cultures at one time point. Significance is denoted by asterisks, where *** indicates p ≤ 0.001, and **** indicates p ≤ 0.0001. (a) The turbidity (optical density) of C. reinhardtii following dosing with AZD8055. Cells were dosed in mid-exponential phase. Control cultures were dosed with DMSO, the solvent used for AZD8055. (b) The total dry mass of the cultures with and without AZD8055 treatment. (c) The cell diameter of the cultures with and without AZD8055 treatment. (d.) The Chl a content of cultures following treatment in mid-exponential phase. Chl a is an indication of both organismal health as well as photosynthetic productivity.

