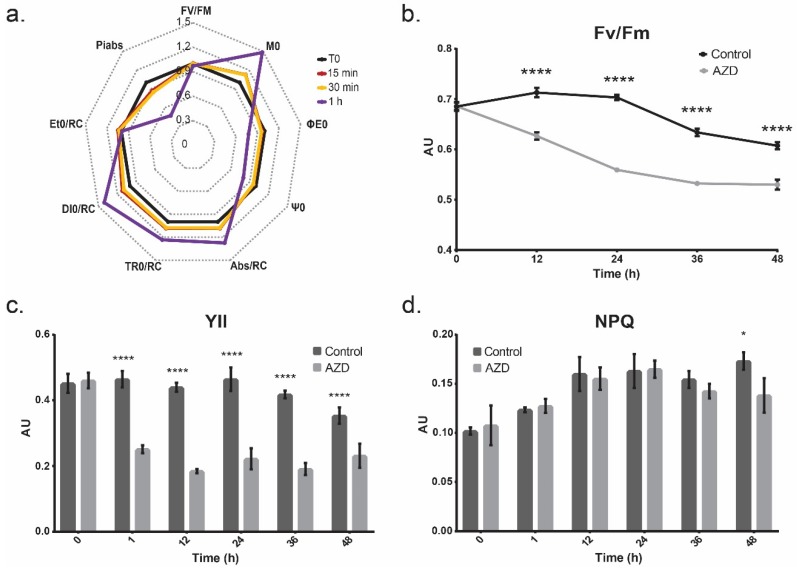
Figure 4.
Photosynthesis measurements taken after treatment. The error bars represent standard deviation and statistical differences indicate a difference between the inhibited and non-inhibited cultures at one time point. Significance is denoted by asterisks, where * indicates p ≤ 0.05, and **** indicates p ≤ 0.0001. (a.) Chl a fluorescence OJIP parameters of AZD-dosed cultures over the course of 1 h, where t0 is normalized to 1, enabling visualization of rapid changes in the photosynthetic apparatus. Changes in OJIP parameters relative to the control, as well as the derivations and explanations of all parameters, can be found in supplemental materials. (b.) FV/FM, the measure of quantum efficiency of PSII following dark adaptation, of the cultures with and without AZD treatment. (c.) The photochemical yields of photosystem II with and without treatment with AZD8055 measured using PAM fluorescence. (d.) The nonphotochemical quenching of the cultures with and without AZD8055 treatment measured using PAM fluorescence.

