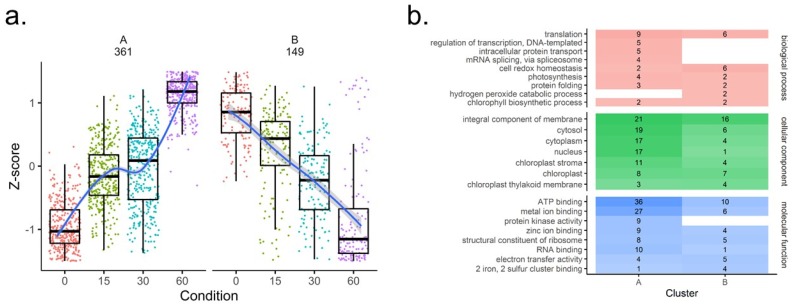
Figure 5.
Differential analysis of the reversibly oxidized cysteine thiol proteome. (a.) Hierarchical clustering of the 510 identifiers significantly changing (p < 0.05, FC > ±2) into two clusters. (b.) Gene ontology (GO) summary of significantly changing identifiers in clusters A and B from hierarchical clustering analysis. The number and shading correspond to the number of unique proteins in each category for each cluster.

