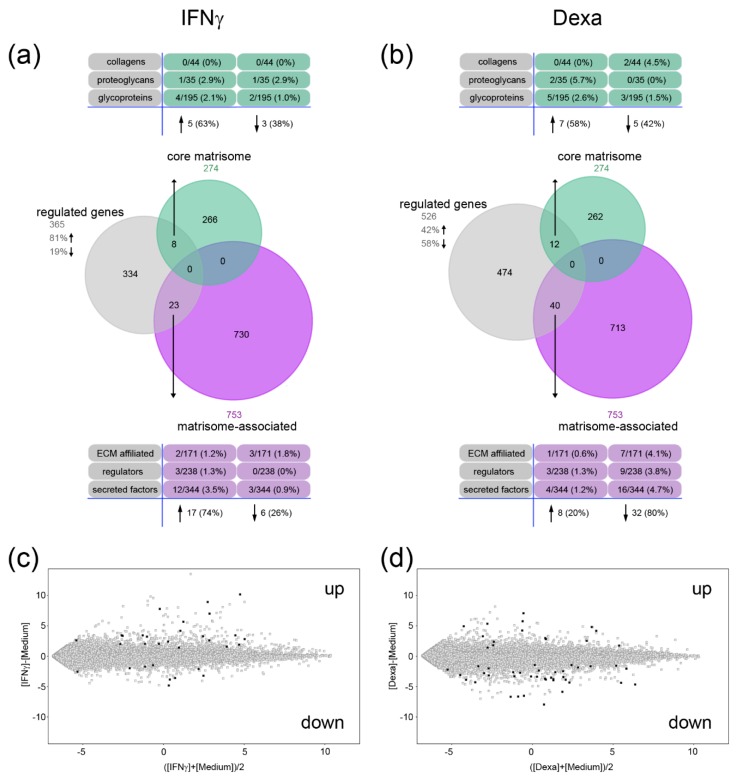
Figure 3.
Regulation of core matrisome and matrisome-associated genes after interferon gamma (IFNγ) and dexamethasone (Dexa) stimulation. (a,b) The proportion of entities among the regulated genes in IFNγ- (a) or dexamethasone-primed macrophages (b) that are found in the core matrisome or matrisome-associated data set are shown in a Venn diagram. The numbers and percentages of genes in the subcategories are listed. (c,d) Expression intensity plots for IFNγ- (c) or dexamethasone-primed macrophages (d) are shown. Regulated genes within the core matrisome and the matrisome-associated cluster are highlighted in black. (fold change ≥ 2, p < 0.05, false discovery rate (FDR) correction by Benjamini-Hochberg, medium versus IFNγ or medium versus dexamethasone).

