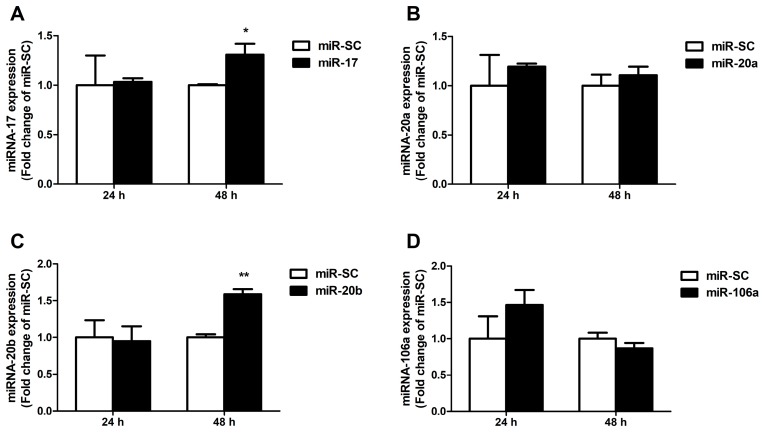
Figure 4.
Expression of the selected miRNAs in Caco-2 cells. (A) The results of a quantitative RT-PCR analysis of the miR-17 expression level in Caco-2 cells transfected for 24 h and 48 h. (B–D) The levels of the miR-20a, miR-20b and miR-106a in Caco-2 cells were measured by qRT-PCR at 24 h and 48 h after transfection. Values were expressed as means ± SEM, n = 3 in each group, * p < 0.05, ** p < 0.01.

