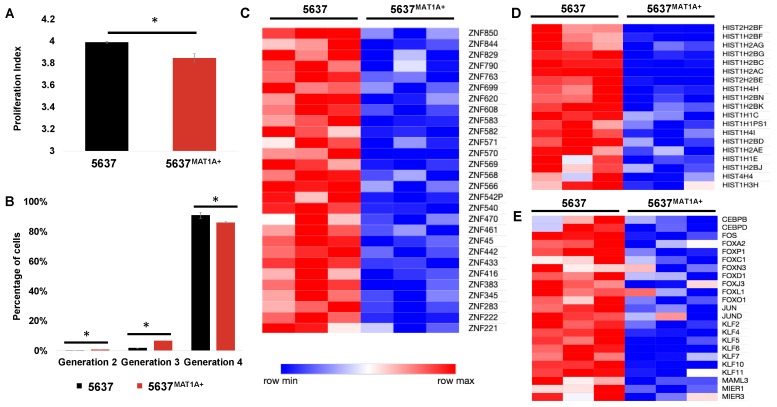
Figure 5.
MAT1A overexpression decreases cell proliferation and transcriptional activity. (A) Proliferation indices over 72 h (* p < 0.05) in 5637 and 5637MAT1A+ cells and (B) percentage of 5637 versus 5637MAT1A+ cells in various generations following initial cell seeding at generation zero (* p < 0.05). Cells were stained with carboxyfluorescein diacetate succinimidyl ester (CFSE) and analyzed using flow cytometry to evaluate changes in proliferation. Data was analyzed and proliferation was modeled in FlowJo®. RNA-seq analysis identified whole genome transcriptomic alterations in 5637MAT1A+ and 5637 cells. Heat maps representing differentially expressed genes (n = 3 biological replicates) reveal downregulation in three gene groups: (C) zinc finger, (D) histone, and (E) transcription factors.

