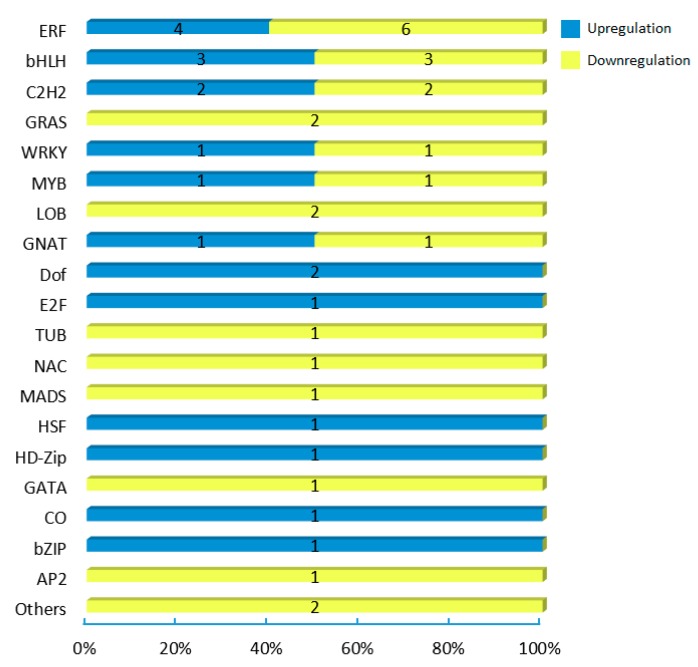
Figure 7.
The distribution of putative target transcription factors of CsCBFs. Blue and yellow indicate significant up- and downregulation of the target genes, respectively. The numbers on bars represent the number of transcription factors, and the percentages on the horizontal axis represent the percentage of the number of transcription factors.

