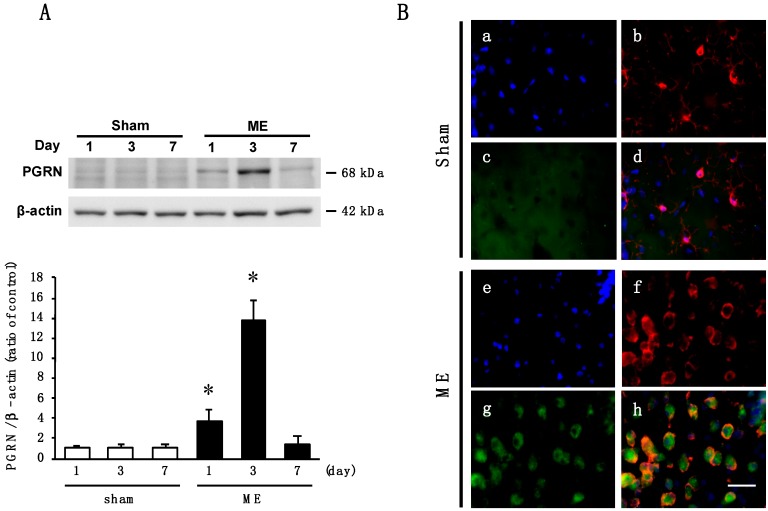
Figure 1.
(A) Time course of changes in the levels of Progranulin (PGRN) protein in the sham- (sham; white bars) and microsphere-induced cerebral embolism (ME)-operated groups (ME; black bars) on days 1, 3, and 7 after surgery. Bands corresponding to PGRN were scanned, and the scanned bands were normalized by β-actin on the same blot. Results are expressed as the mean ratio of non-operated (control) group ± SD (n = 9 each). * Significant difference from the sham-operated group (p < 0.05); (B) Cellular localization of PGRN in the cortex of sham-operated (a–d) and ME-operated (e–h) rats on day 3 after surgery. Images of triple staining (merge, d and h) with Hoechst 33342 (blue, a and e), Iba-1 (red, b and f), and PGRN (green, c and g). The scale bar represents 30 μm.

