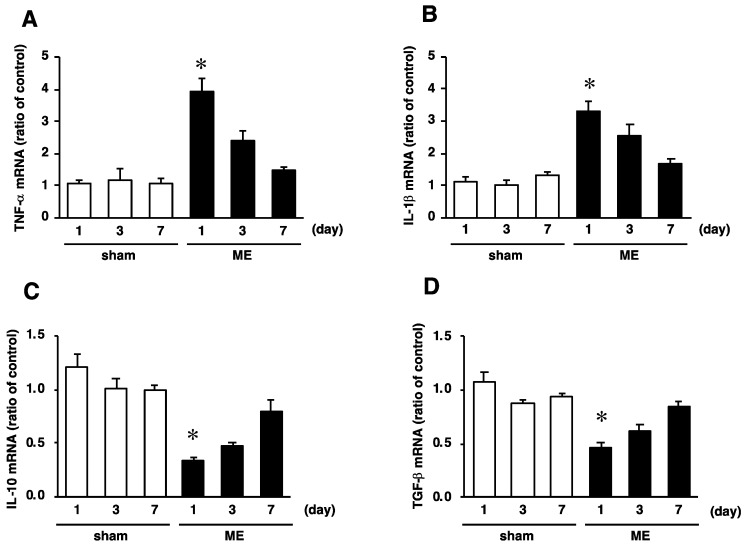
Figure 4.
Time course of changes in the mRNA levels of TNF-α (A), IL-1β (B), IL-10 (C), and TGF-β (D) in the sham-operated (sham; white bars) and ME-operated groups (ME; black bars) on days 1, 3, and 7 after surgery. Results are expressed as the mean ratio of the non-operated (control) group ± SD (n = 6 independent experiments). * Significant difference from the sham-operated group (p < 0.05).

