Figure 5.
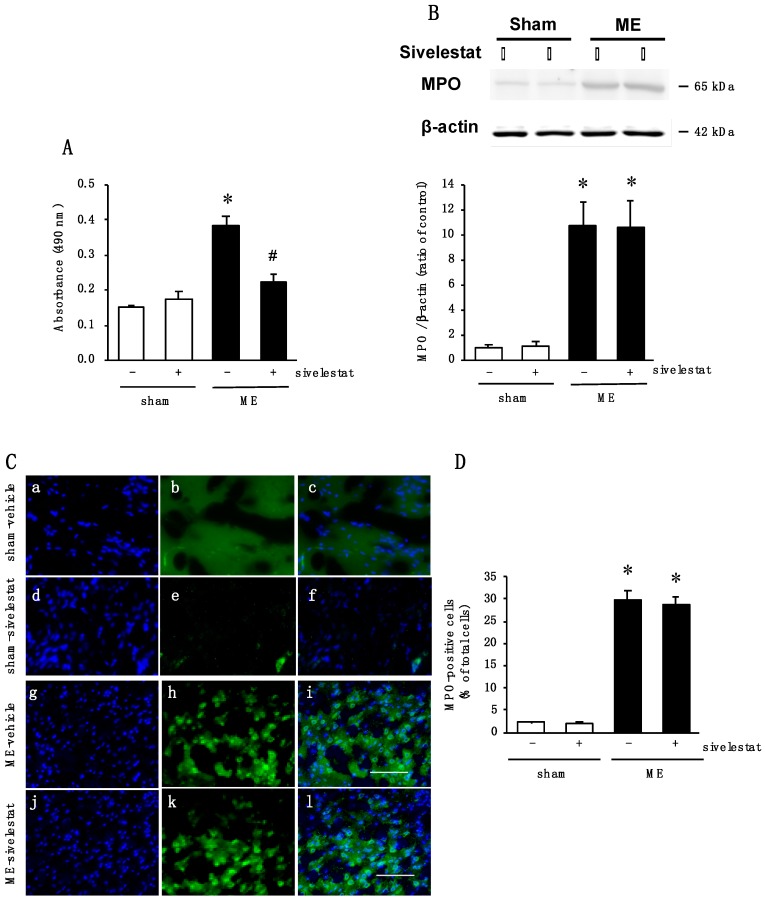
(A) Changes in tissue elastase activity in the vehicle-treated (-) sham and ME groups and sivelestat-treated (+) sham and ME groups on day 1 after surgery. * Significant difference from the vehicle-treated sham group (p < 0.05). # Significant difference from the vehicle-treated ME group (p < 0.05). Each value represents the mean ± SD of 6 animals; (B) Levels of myeloperoxidase (MPO) protein in the vehicle-treated (-) sham and ME groups and sivelestat-treated (+) sham and ME groups on day 1 after surgery. Bands corresponding to MPO were scanned, and the scanned band was normalized by β-actin on the same blot. The results are expressed as the mean ratio of the non-operated (control) group ± SD (n = 8 each). * Significant difference from the sham group (p < 0.05); (C) Images of double staining (merge, c, f, i, and l) with Hoechst 33342 (blue, a, d, g, and j) and MPO (green, b, e, h, and k) for the vehicle-treated sham and ME groups and sivelestat-treated sham and ME groups on day 1 after surgery. The scale bar represents 100 μm; (D) The number of MPO-positive cells in the vehicle-treated (-) sham and ME groups and sivelestat-treated (+) sham and ME groups on day 1 after surgery was counted. Five sections were made per animal, and 266–722 cells were counted per section, and the average of 5 sections per animal was calculated. The values for MPO-positive cells are presented as the mean ± SD (n = 5 each). * Significant difference from the sham group (p < 0.05).

