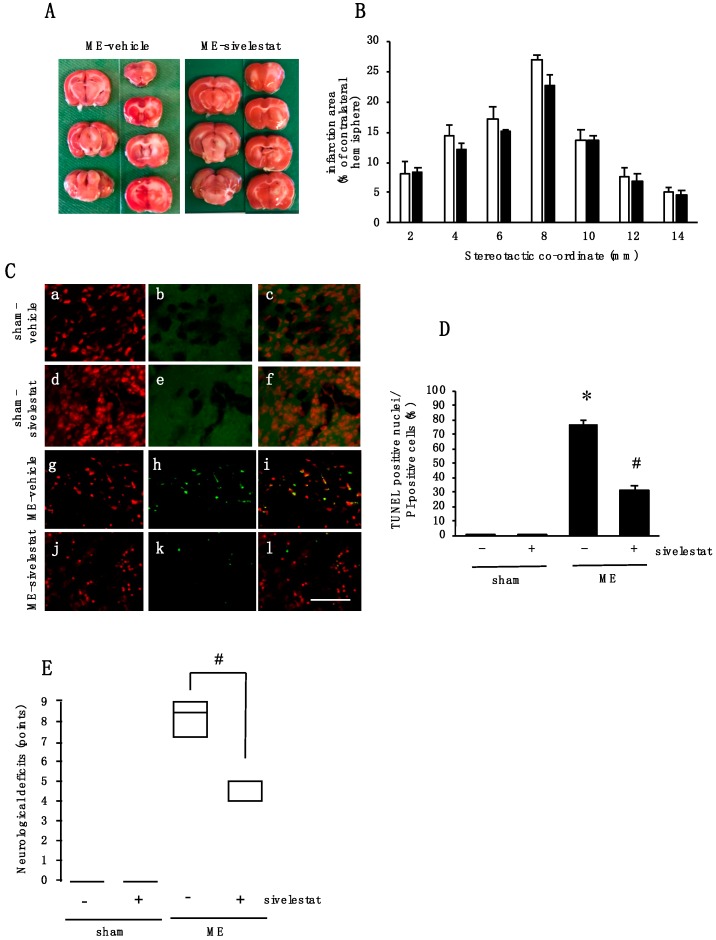
Figure 7.
(A) Representative photographs of 2,3,5-triphenyltetrazolium chloride (TTC) staining from vehicle- and sivelestat-treated ME rats; (B) The infarct area of hemispheres at 2, 4, 6, 8, 10, 12, and 14 mm from the forebrain in the vehicle-treated ME groups (white bars) and sivelestat-treated ME groups (black bars) on day 1 after surgery. The infarct areas are expressed as percentages of the contralateral hemisphere. Values represent the means ± SD (n = 5 each); (C) images of double staining (merge, c, f, i, and l) with PI (red, a, d, g, and j) and TUNEL-positive nuclei (green, b, e, h, and k) for the vehicle-treated sham, ME groups, sivelestat-treated sham, and ME groups on day 1 after surgery. The scale bar represents 50 μm; (D) Effect of sivelestat administration on the number of TUNEL-positive nuclei in the vehicle-treated (-) sham and ME groups and sivelestat-treated (+) sham and ME groups on day 1 after surgery. The number of TUNEL-positive nuclei in the cerebral cortex was counted. Five sections were made per animal, and 319 to 1194 cells were counted per section, and the average of 5 sections per animal was calculated. Values represent the means ± SD (n = 5 each); (E) changes in the neurological deficits of vehicle-treated (-) sham and ME groups and sivelestat-treated (+) sham and ME groups. Each value represents medians and interquartile (n = 8 each). # Significant difference from the vehicle-treated ME group (p < 0.05).

