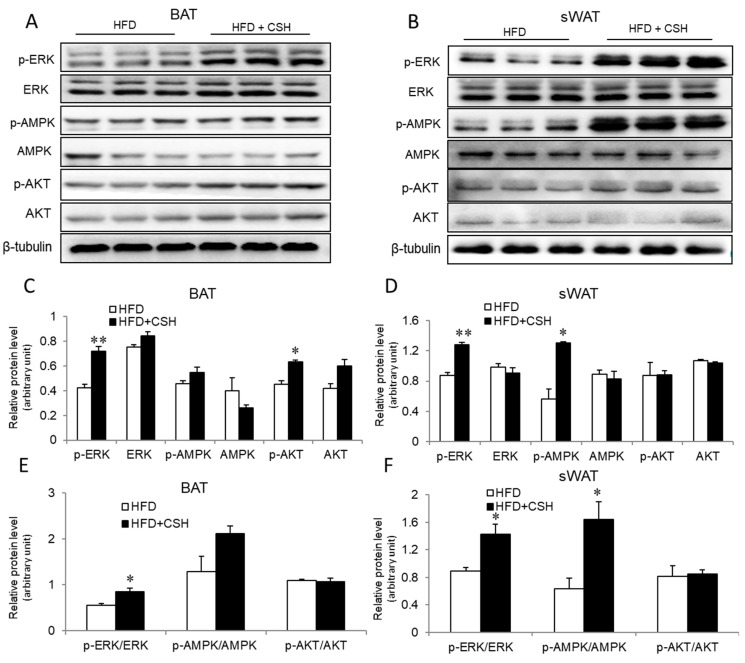
Figure 6.
The expression levels of proteins involved in insulin signaling were analyzed after WECS treatment. The phosphorylation of MAPK was significantly increased after the WECS treatment in BAT and sWAT (A,B). The relative protein level of A and B were shown in (C,D). The relative protein level of p-ERK/ERK, p-AMPK/AMPK, p-AKT/AKT were showed in (E,F). Bars represent the mean + SEM, n = 3. *p < 0.05, **p < 0.01 compared with the HFD control group.

