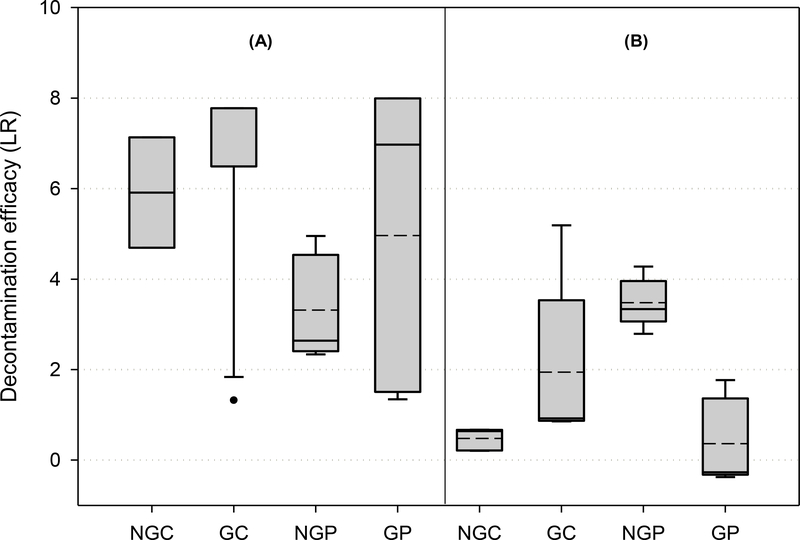
Figure 3. Decontamination efficacy from the laboratory- and operational-scale tests.
Data are reported as the median surface LR ±1 standard deviation with 5th and 95th data percentile from all samples tested for each type of material: non-grimed concrete (NGC), grimed concrete (GC), non-grimed plywood (NGP), grimed plywood (GP). pH-amended bleach (A) and 2% citric acid (B) decontamination solutions delivered via two spray applications with a 30-min total processing time, followed by a water-rinse step. The surface challenge was at 1 × 10⁸ PFU level. The arithmetic mean values are represented by dashed lines.

