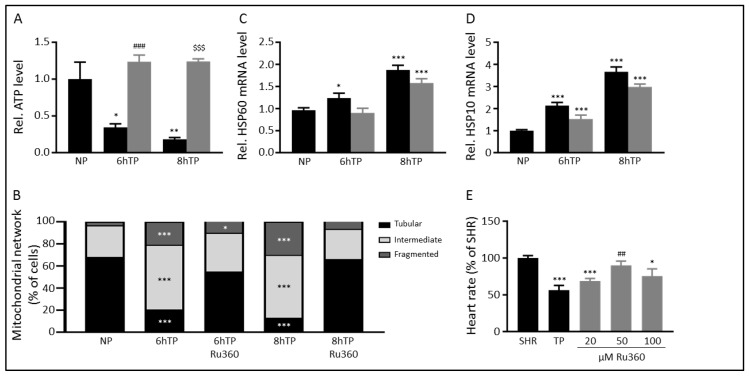
Figure 4.
Inhibition of the MCU by Ru360 protects against mitochondrial dysfunction and stress. (A) Protection of Ru360 (5 µM) treatment on cellular ATP levels after normal-pacing (NP) or tachypacing (TP). Black bars represent non-treated HL-1 cardiomyocytes, grey bars represent Ru360-treated cardiomyocytes. (B) The transition of the mitochondrial network from tubular to fragmented from NP to TP with and without Ru360 treatment. Quantitative real-time PCR of mitochondrial stress markers show no protection of Ru360 on (C) HSP60 and (D) HSP10 transcription levels in response to NP and TP. Black bars represent non-treated HL-1 cardiomyocytes, grey bars represent Ru360-treated cardiomyocytes. (E) Quantified data showing heart wall contraction rates (heart rate) before (SHR, spontaneous heart rate) and after tachypacing (TP and grey bars). Black bars represent non-treated Drosophila, grey bars represent Ru360-treated Drosophila. * p < 0.05, ** p < 0.01, *** p <0.001 vs. NP or SHR, ## p < 0.01, ### p < 0.001 vs. TP (6 h), $$$ p < 0.001 vs. TP (8 h).

