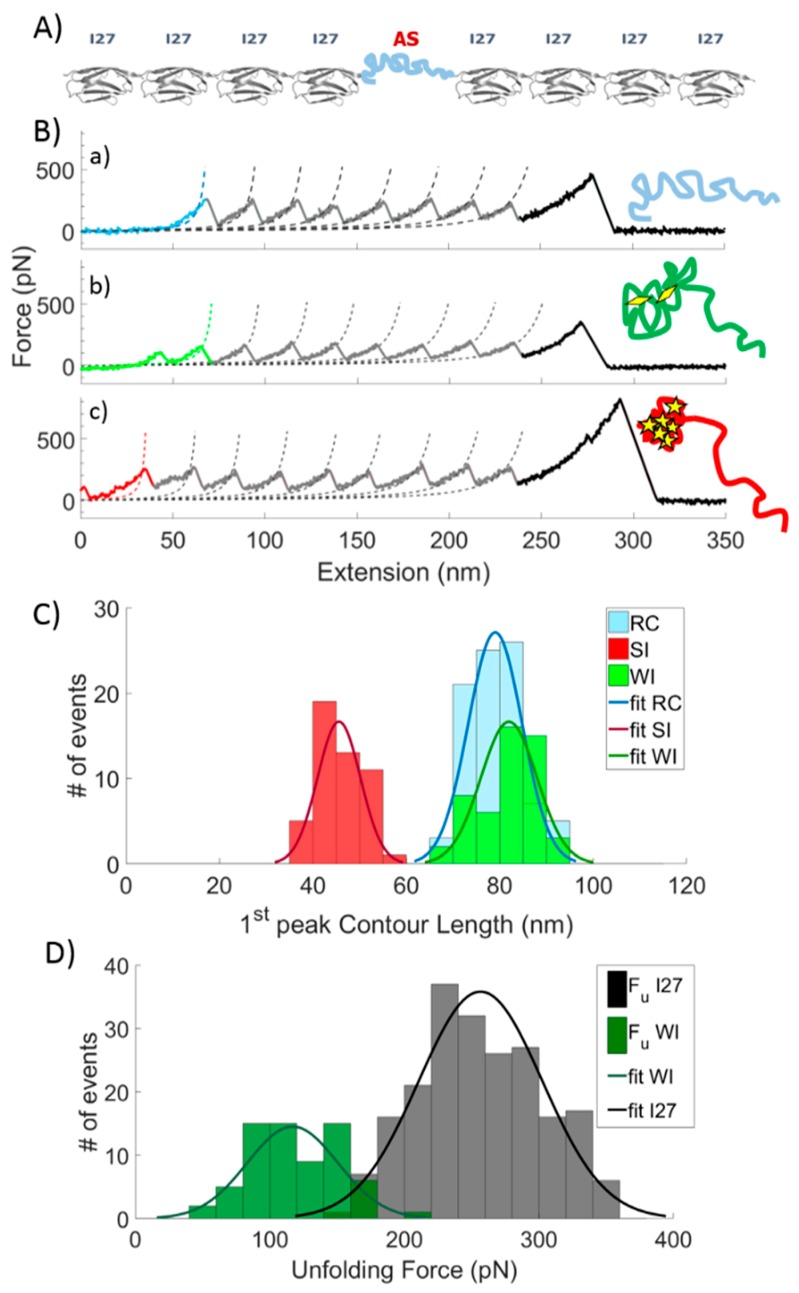
Figure 1.
Representative single molecule force spectroscopy (SMFS) recording of α-synuclein (AS) polyprotein and relative statistical analysis. (A) Polyprotein construct encompassing the AS full-length polypeptide chain for SMFS experiments. (B) Representative force curves of the mechanical unfolding of the polyprotein in distinct conformations stabilized by RC (a), WI (b), and SI (c). Dotted lines are worm-like-chain (WLC) fits to the force-extension curves with free contour length LC and a fixed persistence length Lp = 0.36 nm (see Figure S2 for raw data). Sketches of AS conformations are shown on the right. Diamonds represent weak interactions stabilizing the AS protein, while stars represent strong interactions. (C) Statistical distribution of the contour length of the first peak for RC (LC = 79 ± 6 nm), WI (LC = 82 ± 6 nm), and SI (LC = 46 ± 5 nm) conformations. Solid lines represent the Gaussian fits of the histograms. (D) Unfolding force statistical distribution of WI (FWI = 117 ± 34 pN) and I27 modules (FI27 = 257 ± 46 pN).

