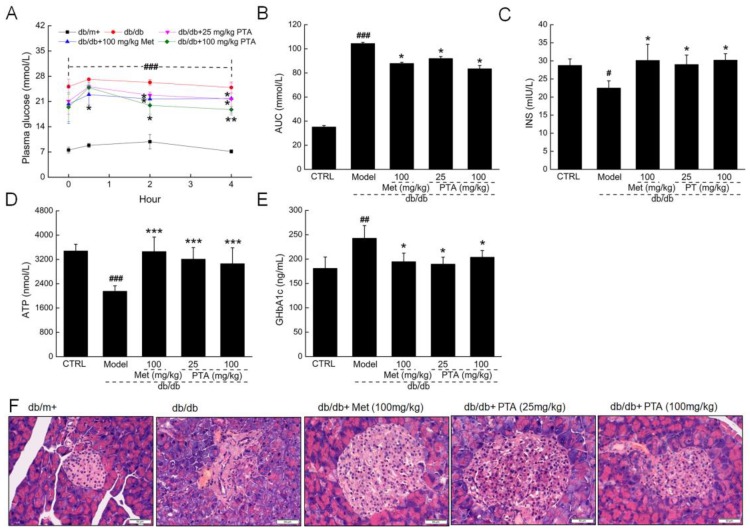
Figure 2.
The hypoglycemic effects of PTA on db/db mice. Blood glucose levels (A) and the values of area under the curve (AUC) (B) within 4 h after glucose administration. ELISA detection of insulin (C), ATP (D), and glycosylated hemoglobin A1c (GHbA1c (E) levels in the sera of db/db mice. Data are expressed as means ± SD (n = 12). # p < 0.05, ## p < 0.01 and ### p < 0.001 vs. C57BLKS/J-LepRdb/+ (db/m+) mice, * p < 0.05, ** p < 0.01 and *** p < 0.001 vs. non-treated db/db mice. (F) Histopathological analysis of pancreatic islets via hematoxylin and eosin (H and E) staining (scale bar: 50 μm; magnification: 200×) (n = 6).

