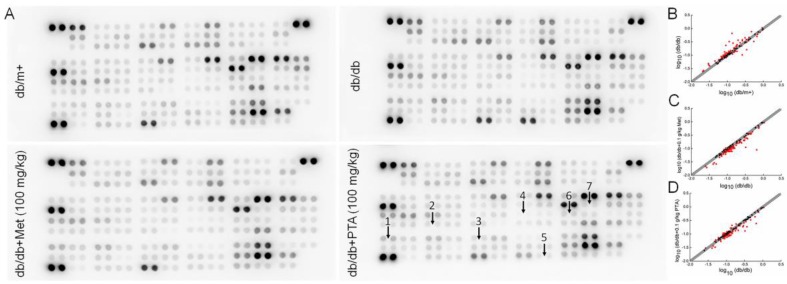
Figure 5.
Analysis of inflammatory factors expressed in the kidneys of db/db mice using a Proteome Profiler Mouse XL Cytokine Array. (A) The graphical representation of cytokine expressions. (B–D) Scatter diagram of 111 different cytokines (n = 3). The relative density represents the ratio of the absolute value and the reference spot value. Red dots indicate factors with a change of >10%. (B) db/db mice vs. db/m+ mice, (C) db/db mice vs. Met (metformin)-treated db/db mice and (D) db/db mice vs. PTA-treated db/db mice. 1, leptin (LEP); 2, interlekin-12 (IL-12); 3, macrophage colony-stimulating factor (M-CSF); 4, IL-2; 5, tumor necrosis factor-α (TNF-α); 6, IL-4; and 7, interferon-γ (IFN-γ).

