Figure 2.
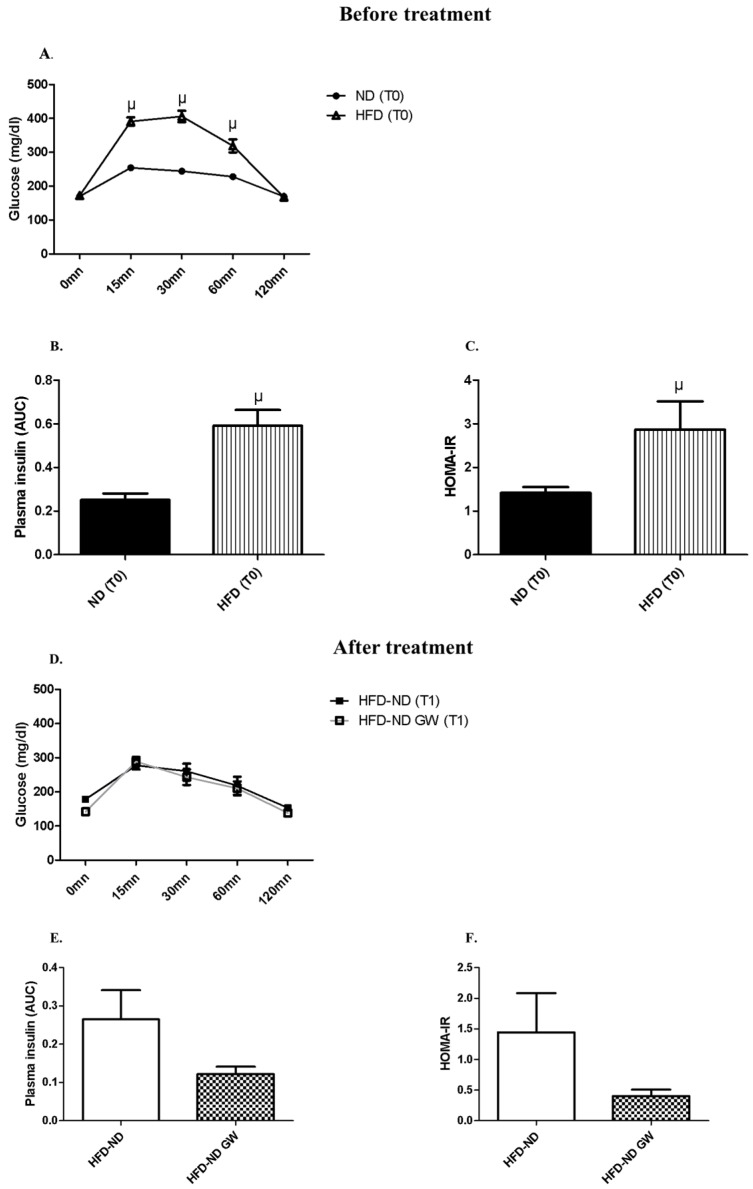
Glucose tolerance curves and insulin plasma concentrations at T0 (after 12-week HFD) and T1 (after 8-week-returning to a ND). (A) Glucose tolerance test (GTT) at T0, i.e. after 12-weeks HFD (n = 12) or ND (n = 6); (B) Plasma insulin Area Under the Curve (AUC) during GTT at T0; (C) HOMA-IR index calculated with basal blood glucose (mmol/L) and blood insulin during GTT at T0. (D) GTT at T1 after returning to ND only (HFD-ND, n = 6) or combined with a PPARβ/δ agonist (GW0742) treatment (HFD-ND-GW, n = 6). (E) Plasma insulin (AUC) during GTT at T1; (F) HOMA-IR index at T1. Data are shown as mean ± SD. µ p < 0.05 vs. ND at T0.

