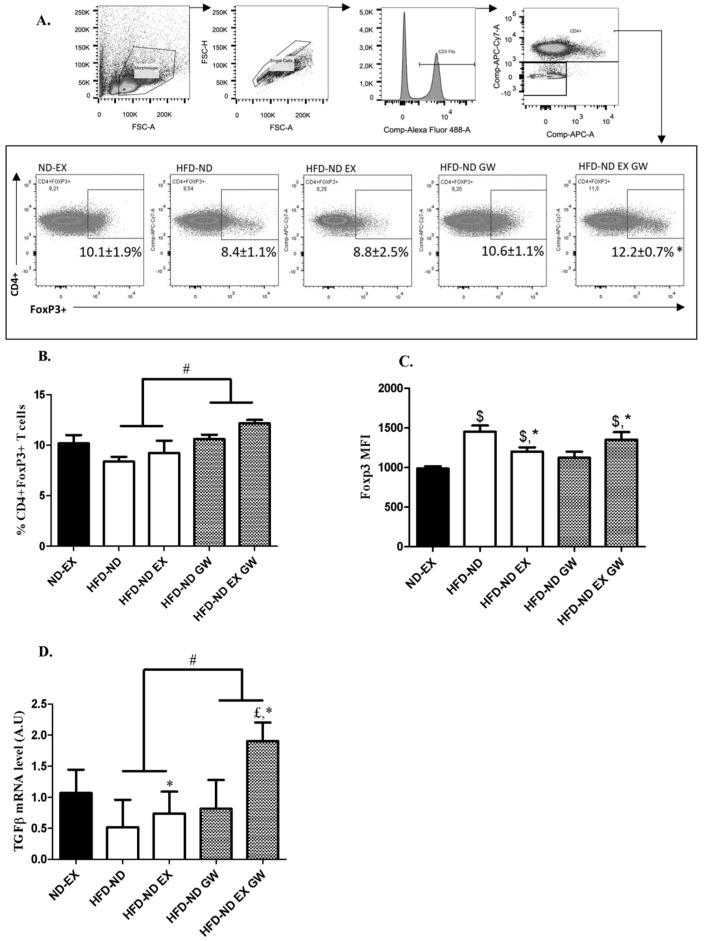
Figure 4.
CD4+ expressing Foxp3 T cells in lymph nodes and TGF-β mRNA levels. (A) Gating strategy of flow cytometry analysis of Foxp3+ on CD4+ cells from lymph nodes. (B) Frequency of CD3+CD4+Foxp3+T cells from lymph nodes after return to ND (T1). (C) Mean Fluorescence Intensity (MFI) in the APC fluorescence channel (gated Foxp3+ in A). (D) mRNA levels of TGF-β relative to 36B4 in lymph nodes. Data are shown as mean ± SD (n = 6 per group). # p < 0.05, GW0742 effect and * p < 0.05, interaction effect between exercise and GW0742 (2-way ANOVAs). $ p < 0.05 vs. ND-EX and £ p < 0.05 vs. all groups (one-way ANOVAs).

