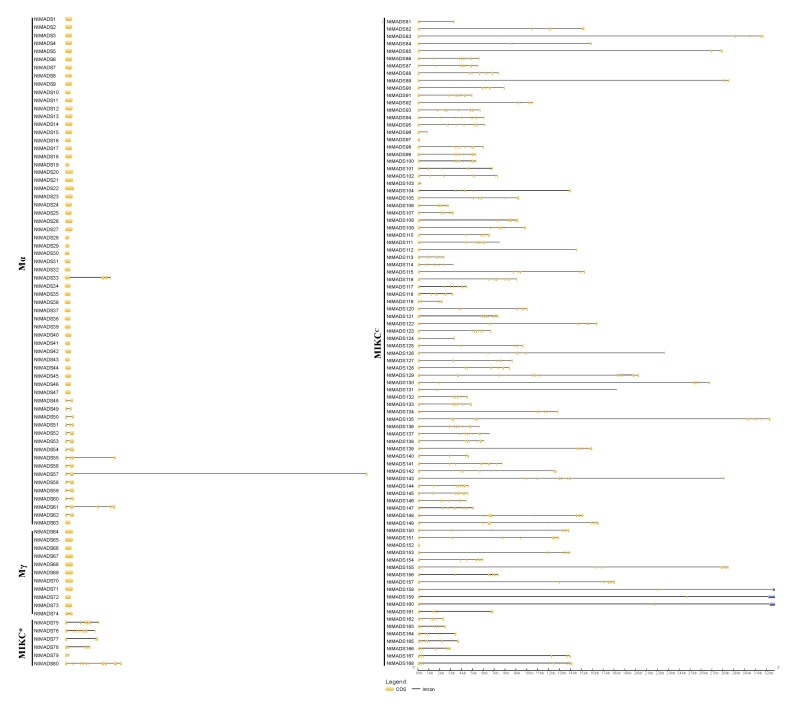
Figure 2.
Gene structure of the NtMADS-box gene family in tobacco. Exon–intron analyses of identical tobacco NtMADS-box genes were performed with GSDS 2.0. Exons and introns are represented by black rectangle and black lines, respectively. The lengths of exons and introns for each tobacco NtMADS-box gene are shown proportionally.

