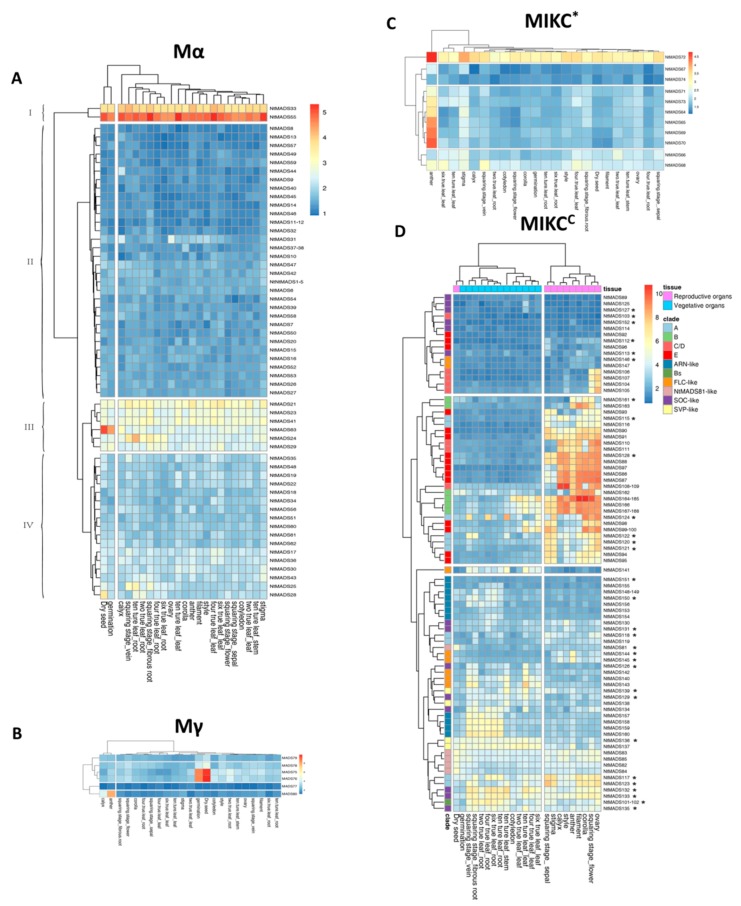
Figure 5.
Expression profiles of 168 NtMADS-box genes in tissues at different developmental stages. The relative transcript abundances of 168 NtMADS-box were examined via microarray and visualized as a heatmap. The expression profiles of NtMADS-box genes in the 23 different samples, including dry seeds, germination seeds, cotyledons, leaves from two-true leaf stage (labeled as two true leaf_leaf), roots from two-true leaf stage (two true leaf_root), leaves from four-true leaf stage (four true leaf_leaf), roots from four-true leaf stage (four true leaf_root), leaves from six-true leaf stage (six true leaf_leaf), roots from six-true leaf stage (six true leaf_root), leaves from ten-true leaf stage (ten ture leaf_leaf), roots from ten-true leaf stage (ten ture leaf_root), and squaring stage (sepal, fibrous root, and flower), vein, ovary, filament, style, corolla, calyx, stigma, and anther. The X axis is the samples in tissues at different developmental stages. The color scale represents Log2 expression values. The symbol of the star in the MIKCC subfamily represents selected genes for confirming the gene expression by qPCR. Three independent biological experiments with four individual plants were collected for RNA extraction.

