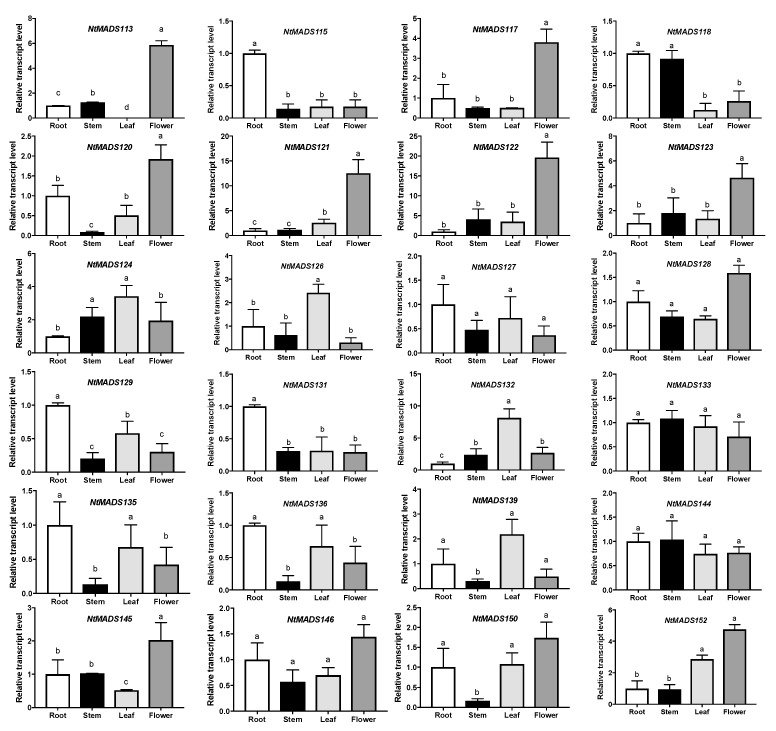
Figure 6.
Expression profiles of 24 selected NtMADS-box genes in tobacco. The relative transcript abundances of 24 selected NtMADS-box genes were examined via qPCR and visualized as a histogram. The tobacco flowers (120 day old plants) and 6–7 week old seedlings grown in the soil were collected. Three independent biological experiments with four individual plants were collected for RNA extraction and qPCR analysis. 26S was used as an internal control. Error bars represent the SD (n = 3). Different letters a,b,c above the bars indicate a significant difference (p < 0.05), as obtained by one-way ANOVA and the LSD test.

