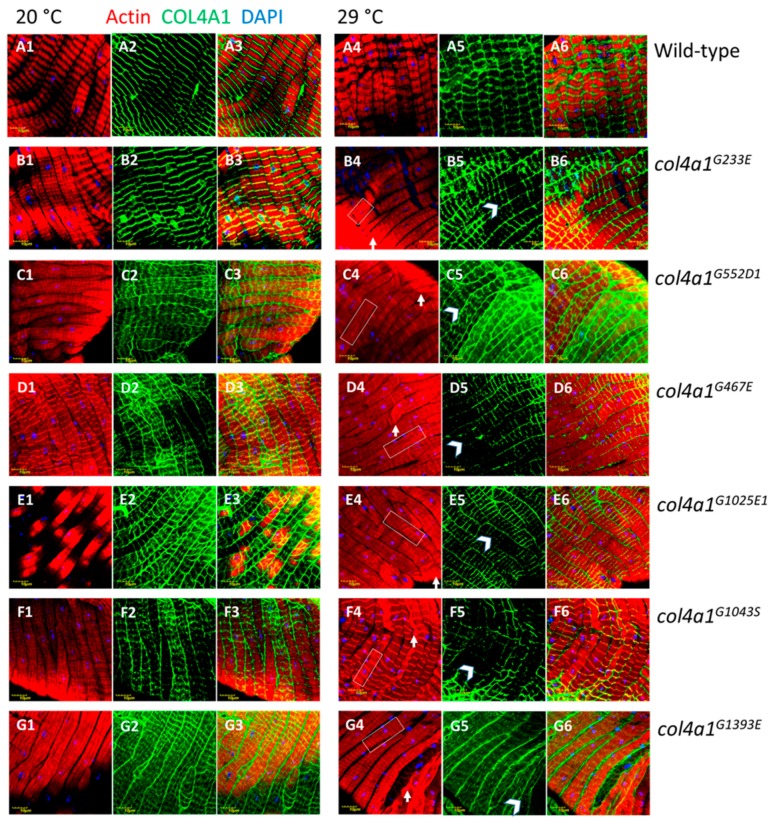
Figure 3.
Loss of sarcomeres in col4a1G233E, col4a1G467E, col4a1G552D1, col4a1G1025E1, col4a1G1043S and col4a1G1393E mutant lines at 29 °C (B4 through G4) in comparison with wild-type control (A4). Representative actin bundles (white rectangles in B4 through G4), actin aggregates (white arrows in B4 through G4), uneven COL4A1 expression (white arrowheads in B5 through G5). A3 through G3 and A6 through G6: Overlays of actin and COL4A1 staining. Bars, lower left, 10 micrometers.

