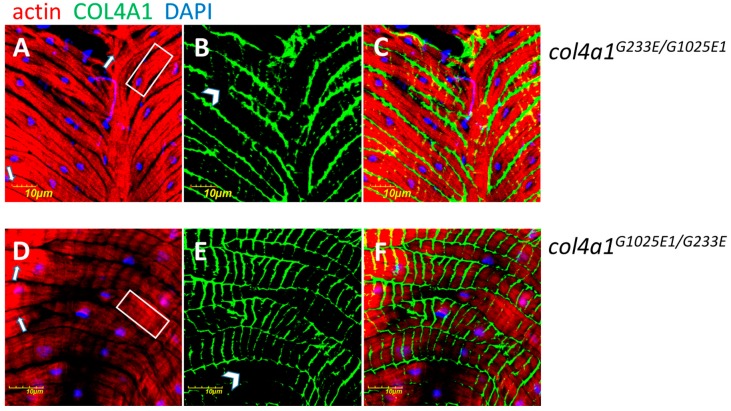
Figure 5.
Sarcomeric loss (A, D), actin bundles (A, D, white rectangles), intensively staining actin aggregates (A, D, white arrows), COL4A1 protein in uneven and irregularly deposited fashion (B, E, white arrowheads) in compound heterozygote col4a1G233E/G1025E1 (A–C) and in reciprocal col4a1G1025E1/G233E (D–F) double mutants. C, F: Overlays of actin and COL4A1 stainings. The experiment was performed at 20 °C. Wild-type control provided in Figure 3, upper row A. Bars, lower left, 10 micrometers.

