Figure 5.
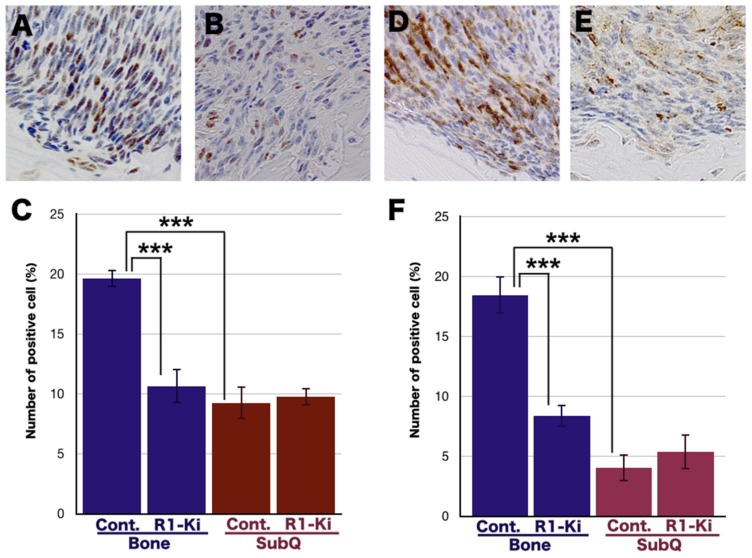
The effect of TGF-β signaling on the induction of CSC in the bone micro-E. (A,B) IHC study of SOX2 staining in the bone micro-E: A large number of SOX2 positive cells can be seen in the control group (A) and fewer positive cells in the R1-Ki treatment group (B). Magnification: 600×. (C) Quantitative analysis: R1-Ki treatment resulted in a significant suppression of SOX2 positive cells in the bone micro-E but not in the subQ micro-E. (D,E) IHC study of CD166 staining in the bone micro-E.; A large number of positive cells can be seen in the control group (D) and fewer positive cells in the R1-Ki treatment group (E). Magnification: 600×. (F) Quantitative analysis; R1-Ki treatment resulted in a significant suppression of CD166 positive cells in the bone micro-E, but not in the subQ micro-E. ***: p < 0.001.

