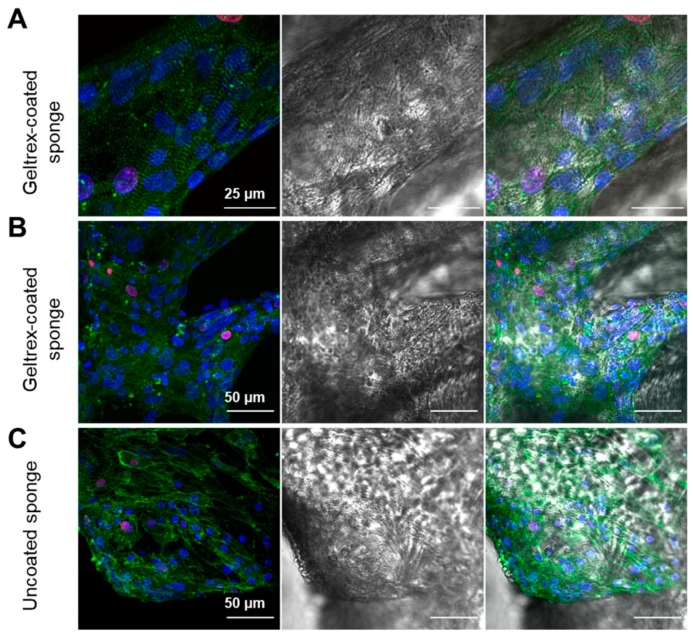
Figure 9.
Staining of α-actinin, Ki-67, and cell nuclei to document cell alignment and proliferation of iPSC-CMs on I. labyrinthus scaffolds. Left panel shows fluorescence channels of α-actinin (green), Ki-67 (magenta), and nuclei (blue), middle panel represents brightfield image, and right panel overlay of brightfield and fluorescence channels. (A) iPSC-CMs on Geltrex®-coated scaffold representing sarcomere structures of cells attached to a chitin fiber and the presence of a minor population of Ki-67 positive cells. (B,C) Representative images of iPSC-CMs on Geltrex®-coated and uncoated sponge scaffolds.

