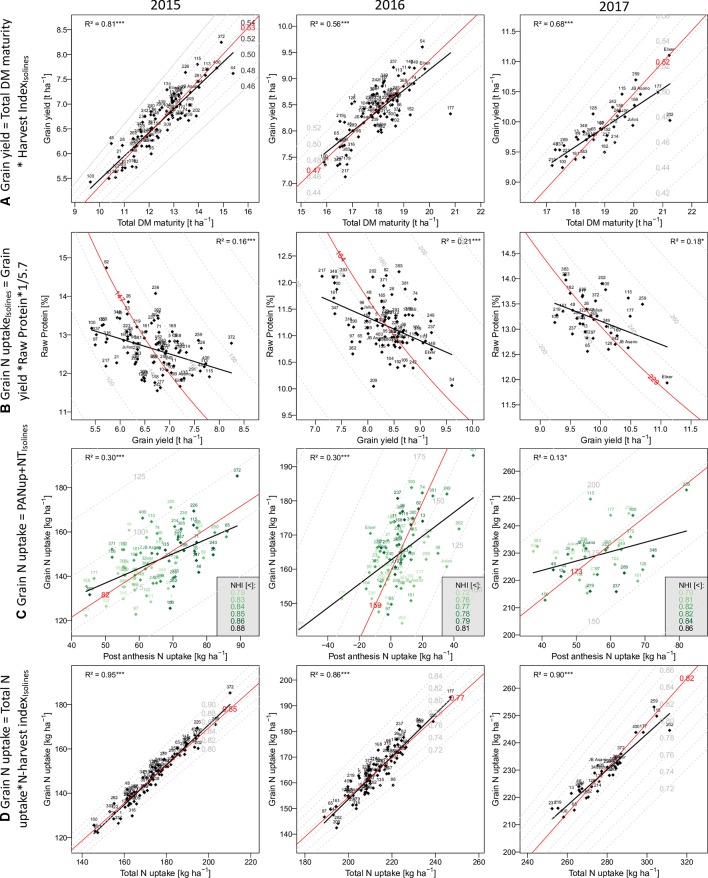
Figure 2.
The relationship of selected traits with grain yield and grain N uptake: Traits on the y-axes are described as product(A and D) or as sum (C) of the traits on the x-axes and the dashed isolines. In (B) the grain N uptake on the isolines is the product of the x- and y-axes traits. Numbers and names indicate different breeding lines and the three reference cultivars, respectively. Red isolines and numbers indicate the position and average value of the isoline trait, respectively. Black regression lines and the coefficients of determination describe the relationship between the x- and y-axes traits.

