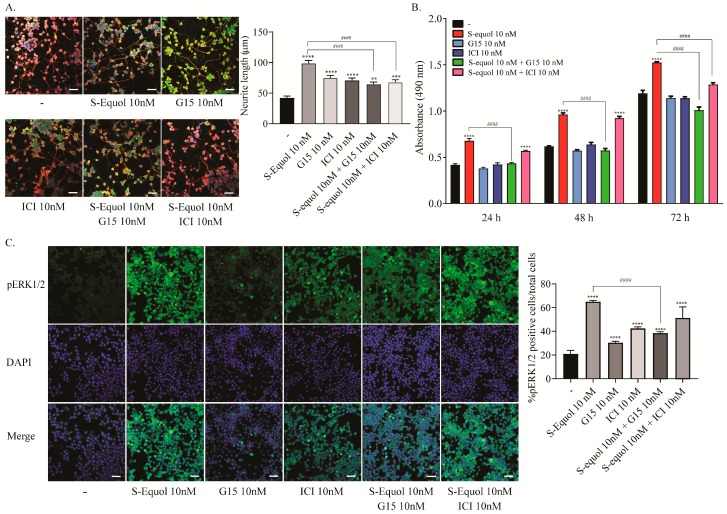
Figure 2.
Effects of S-equol on the differentiation, proliferation and phosphorylation of ERK1/2 of Neuro-2A cells. Neuro-2A cells were induced to differentiate by serum starvation and culturing for one to three days, followed by an immunohistochemical analysis with doublecortin (green), β-tubulin III (red), and DAPI (blue). (A) Representative photomicrographs showing the effects of S-equol, G15, and/or ICI on the differentiation of Neuro-2A cells. The right panel shows the changes in neurite lengths after exposure. The neurite lengths were quantified using ImageJ Fiji software (NIH). The bars indicate 50 μm. (B) Time-dependent changes in the effects of S-equol, G15, and/or ICI on cellular proliferation. Neuro-2A cells were exposed to S-equol, G15, and/or ICI, for 24, 48, and 96 h, respectively. Cell viability was determined with an MTS assay and the number of viable cells was calculated as a percentage of the control viability. (C) Representative photomicrographs showing the immunohistochemistry for pERK1/2 and DAPI staining to examine the effect of S-equol, G15, and/or ICI on pERK1/2 expression. The right panel shows the changes in the percentages of pERK1/2 positive cells after exposure. The bars indicate 50 μm. Data are expressed as the mean ± SEM and are representative of at least three independent experiments. ****p < 0.0001, ***p < 0.001, and **p < 0.005, indicate statistical significance according to Bonferroni’s test compared with control (-). ####p < 0.0001, indicates statistical significance according to Bonferroni’s test compared with S-equol.

