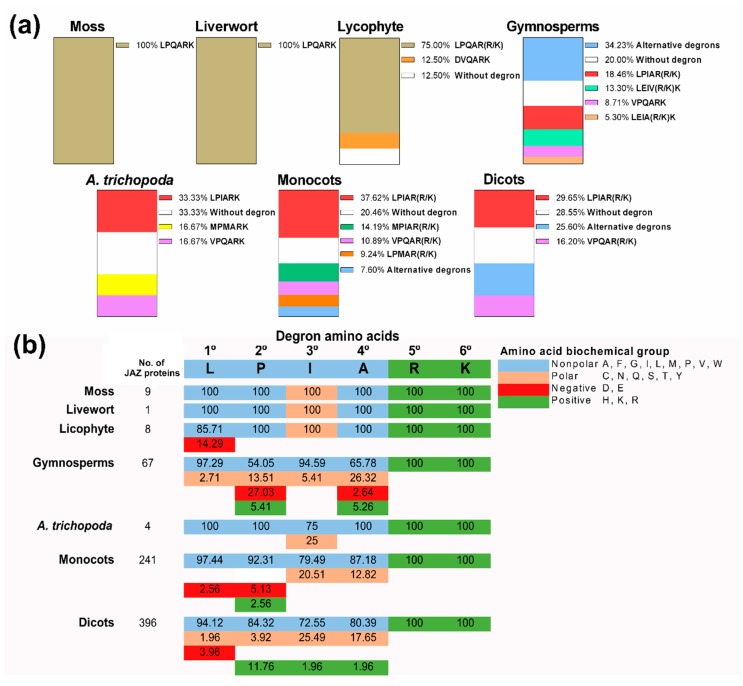
Figure 5.
Analysis of degron sequences in different lineages of the plant kingdom. (a) Percentage (%) of specific degron sequences in each plant lineage. (b) Percentage (%) of different amino acid biochemical groups in each position of the degron sequence compared with the canonical degron LPIARK. The percentage (%) of specific degrons was obtained from 9, 1, 8, 195, 6, 303 and 543 sequences for moss, livewort, lycophyte, gymnosperms, Amborella trichopoda, monocots and dicots, respectively. The percentage (%) of different amino acid biochemical groups in each position of the degron sequence was obtained from 1, 1, 3, 37, 3, 39 and 51 different degron sequences for moss, livewort, lycophyte, gymnosperms, A. trichopoda, monocots and dicots, respectively.

