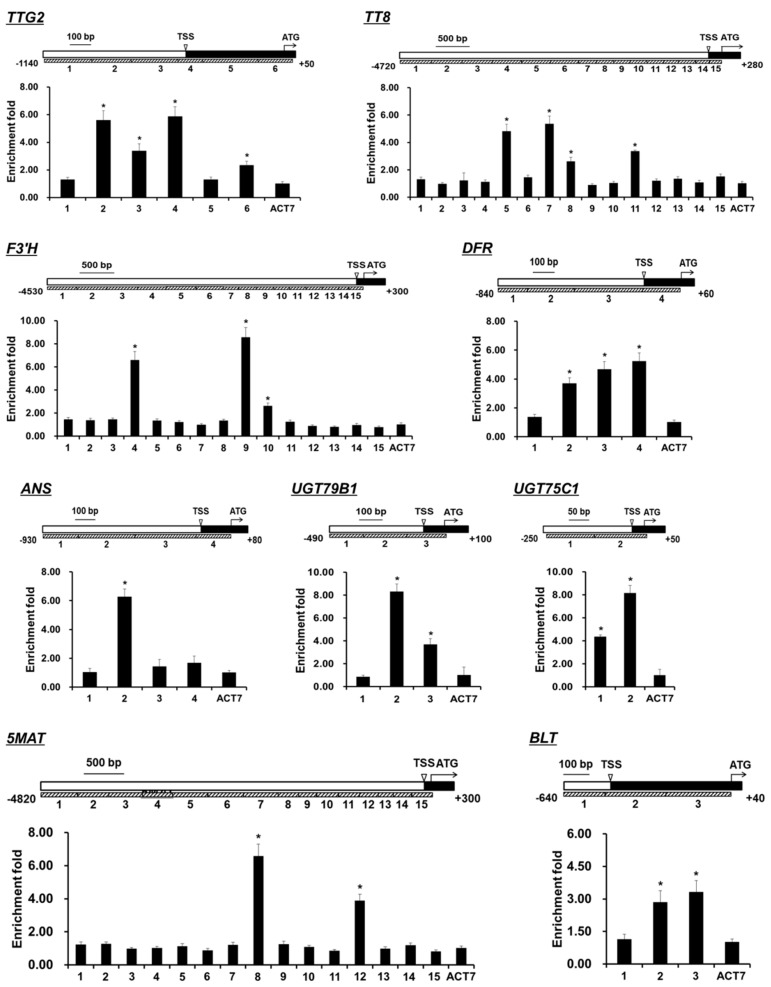
Figure 4.
Schematic diagrams illustrate the promoter regions of TTG2, TT8, F3’H, DFR, ANS, UGT79B1, UGT75C1, 5MAT, and BLT, and ChIP analysis indicates the TTG1-dependent MBW complex binding to their promoter regions in in the young shoots and expanding true leaves at 20 days after germination. The transcriptional start site (TSS) and exon are indicated by black boxes, whereas promoter regions are indicated by white boxes. Gray boxes represent the DNA fragments amplified in ChIP analysis for each gene. The enrichment fold of each fragment was calculated first by normalizing the amount of a target DNA fragment against a genomic fragment of EF1aA4 as an internal control and then by normalizing the value for dexamethasone-treated ttg1-13 35S:TTG1-GR against that for mock-treated ttg1-13 35S:TTG1-GR. An ACTIN7 (ACT7) fragment was amplified as a negative control. Asterisks indicate significant differences in comparison with the enrichment of the ACT7 fragment (two-tailed paired Student’s t test, p ≤ 0.05). Values are means ± SD (n = 3). Error bars denote SD.

