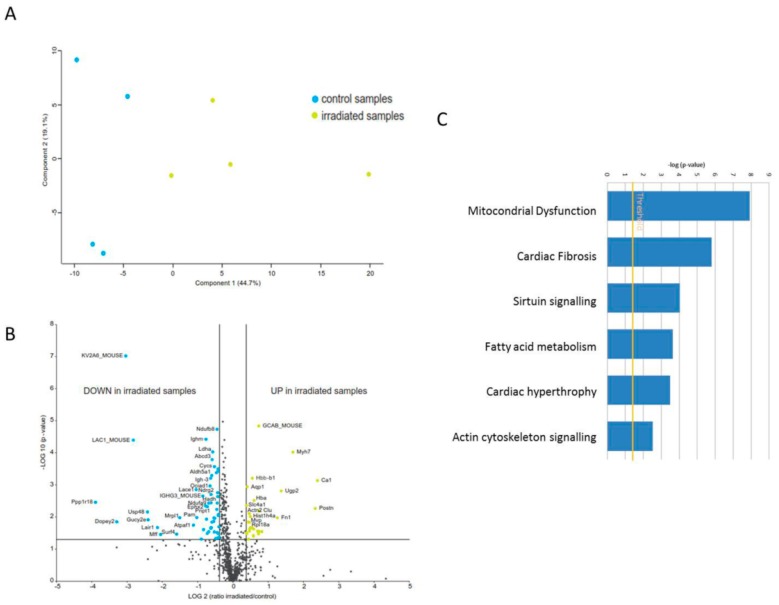
Figure 1.
Proteome analysis of mitochondrial proteins in the irradiated heart. (A) Principal component analysis (PCA) based on all proteomic features. (B) Graphical representation of quantitative proteomics data of cardiac mitochondria after chronically exposure to accumulated doses of 6 Gy. Proteins are ranked in a volcano plot according to the −log10 of their statistical p-value (y-axis) and log2 fold change (x-axis). The yellow points represent the significantly more abundant proteins in cardiac mitochondria after irradiation, the blue points represent the significantly less abundant proteins. (C) The most significant canonical pathways altered by irradiation. The analyses were generated through the use of IPA (QIAGEN Inc., https://www.qiagenbio-informatics.com/products/ingenuity-pathway-analysis). Bars indicate canonical pathways and the y-axis displays the −(log p) enrichment significance. Taller bars are more significant than shorter bars.

