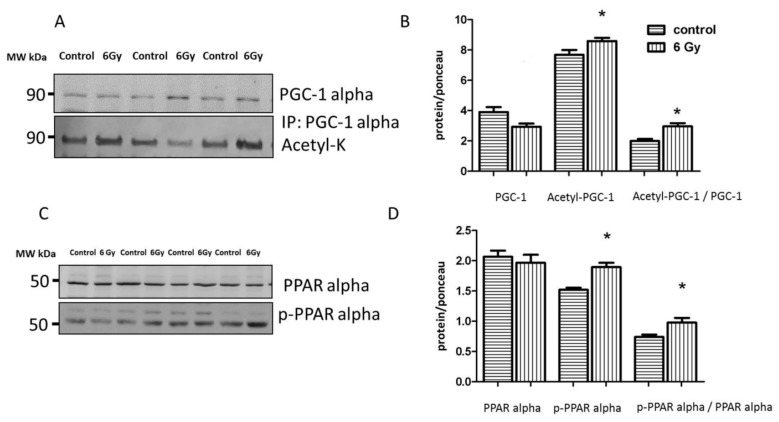
Figure 8.
Analysis of the cardiac PGC-1 and PPAR alpha protein expression. Immunoblot analysis of total PGC1, and acetylated form (inactive) in whole heart lysate is shown (A). The columns represent the average ratios of relative protein expression in control and irradiated samples. The error bars represent standard error of the mean (± SEM) (t-test; * p < 0.05; n = 3) (B). Immunoblot analysis of total and phospho-PPAR alpha (Ser12) in whole heart lysate samples is shown (C). The amount of the total protein was measured by Ponceau S staining for an accurate comparison between the groups. The columns represent the average ratios of relative protein expression in control and irradiated samples after background correction (D). The error bars represent standard error of the mean (± SEM) (t-test; * p < 0.05; n = 4).

