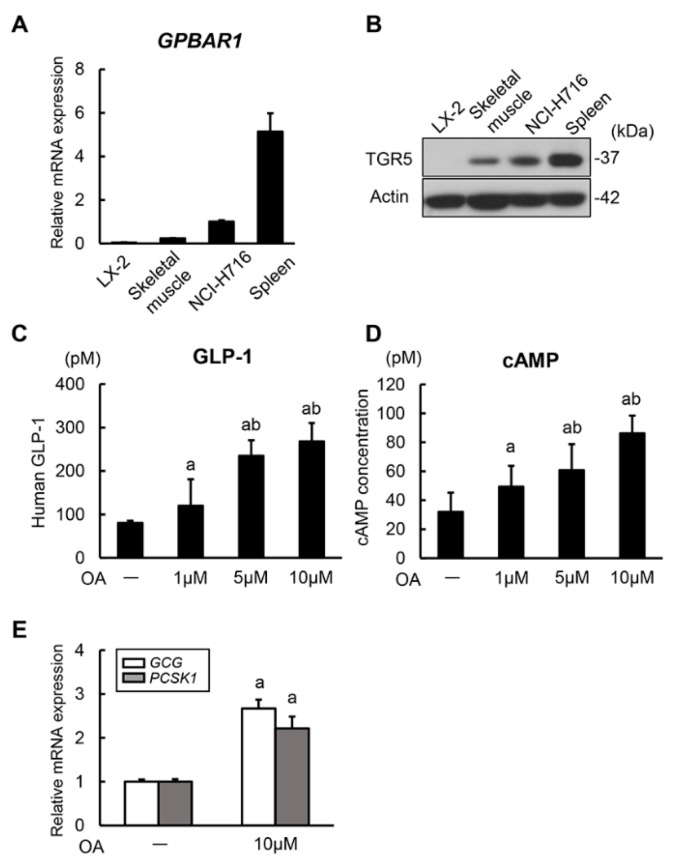
Figure 1.
GLP-1 synthesis and secretion in human intestinal cells. (A) Relative mRNA expression levels of human GPBAR1. Quantitative values are indicated as ratios to the values of NCI-H716. Human skeletal muscle and spleen tissues were used as controls. (B) Western blots of whole cell lysates for the expression of TGR5. Actin was used as internal control for western blotting. (C) Measurement of human GLP-1 concentrations in NCI-H716 cell-cultured media. NCI-H716 cells were cultured with different concentrations of oleanolic acid (OA) for 2 h. (D) Measurement of human intracellular cAMP concentrations in NCI-H716 cells. NCI-H716 cells were cultured with different concentrations of oleanolic acid for 2 h. (E) Relative mRNA expression levels of human GCG and PCSK1 in NCI-H716 cells treated without and with oleanolic acid (10 μM) for 2 h. Quantitative values are indicated as ratios to the values of OA (–)-group. Relative mRNA expression levels were measured by quantitative RT-PCR (qRT-PCR). GAPDH was used as internal control for qRT-PCR (A,D). Data are mean ± SEM (n = 8). a, P ≤ 0.05 compared with OA (–)-group; b, P ≤ 0.05 compared with OA (1 μM)-group (B–D).

