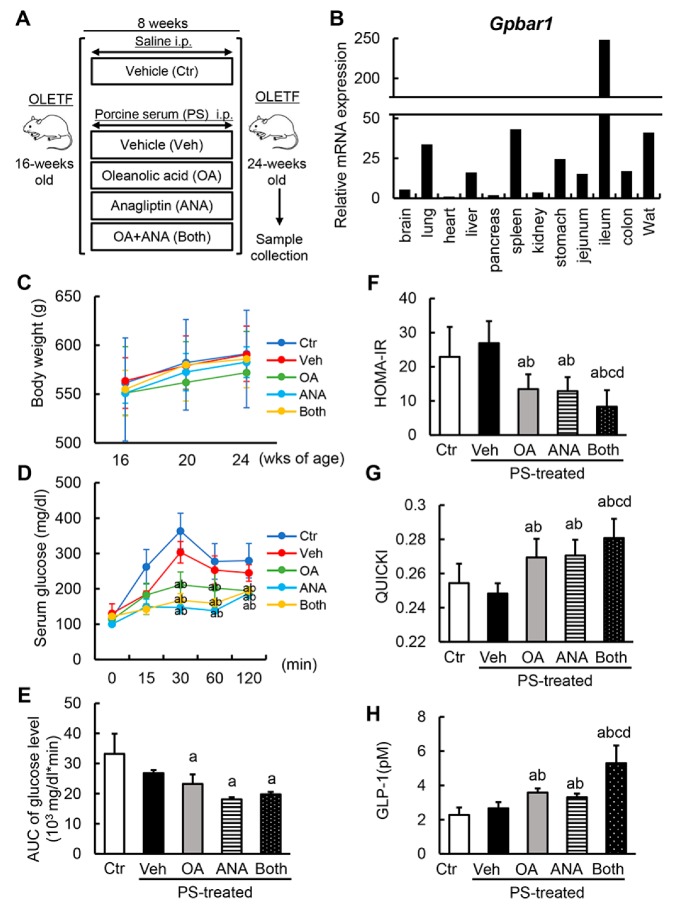
Figure 2.
In vivo effects of oleanolic acid and anagliptin on glycemic status. (A) Schematic of porcine-serum (PS)-induced rat liver fibrosis models. (B) Histological distribution of Gpbar1 mRNA expression in OLETF rats. Quantitative values are relatively indicated as ratios to the values of rat heart tissue. (C) Changes in body weights during experimental period. (D) Serum glucose levels in oral glucose tolerance test (OGTT) at the end of experiment. (E) The values of glucose–AUC (area under the blood concentration–time curve) in the experimental groups. The values of AUC were calculated as area under the curve of serum glucose levels at OGTT. (F,G) The values of homeostasis model assessment–insulin resistance (HOMA–IR) (F) and Quantitative Insulin Sensitivity Check Index (QUICKI) (G) in experimental rats. (H) The serum levels of rat GLP-1 at the end of experiment. Relative mRNA expression levels were measured by quantitative RT-PCR (qRT-PCR). Gapdh was used as internal control for qRT-PCR (B). Data are mean ± SD (B–G; n = 10, H; n = 8). Ctr; negative control group, Veh; vehicle-treated PS-injected group, OA; oleanolic acid-treated PS-injected group, ANA; anagliptin-treated PS-injected group, Both; oleanolic acid and anagliptin-treated PS-injected group. a, P ≤ 0.05 compared with Ctr-group; b, P ≤ 0.05 compared with Veh-group; c, P ≤ 0.05 compared with OA-group; d, P ≤ 0.05 compared with ANA-group.

