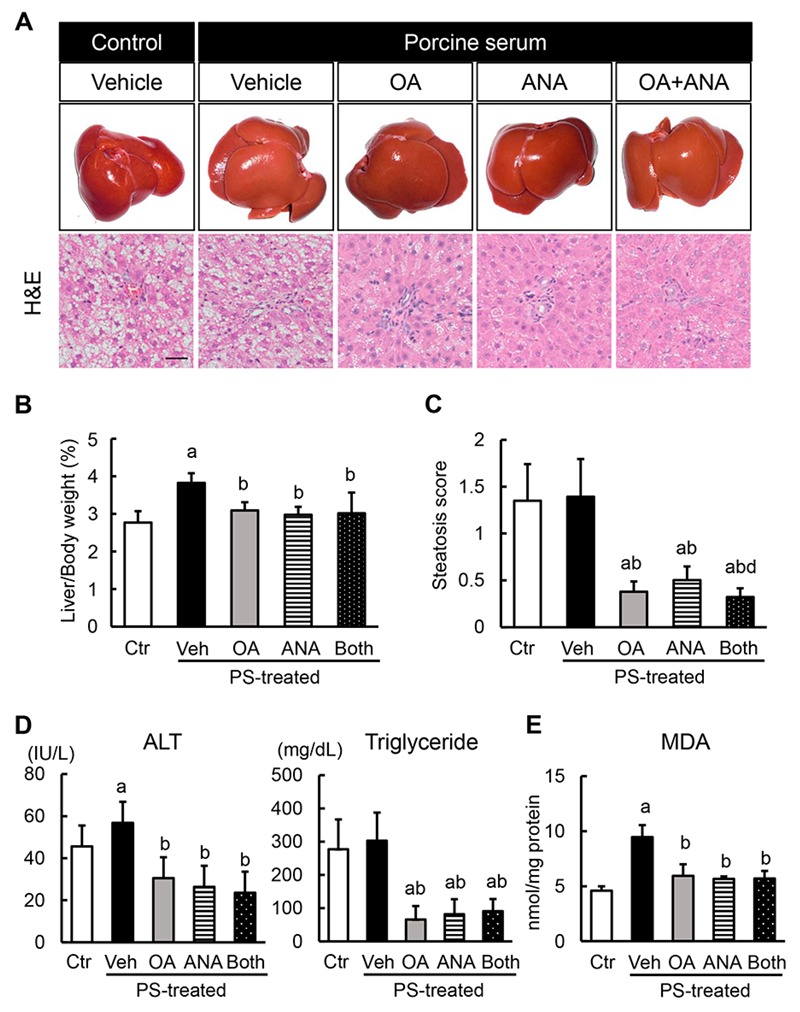
Figure 3.

In vivo effects of oleanolic acid and anagliptin on hepatic steatosis and lipid peroxidation. (A) Representative macroscopic appearances (upper panels) and microphotographs of hematoxylin and eosin (HE) staining (lower panels) in the experimental groups. Scale bar; 50 μm. (B) Ratio of liver to body weight. (C) Histological score of steatosis according to NAFLD Activity Score. (D) Serum levels of alanine aminotransferase (ALT) and triglyceride (TG). (E) Hepatic concentrations of malondialdehyde (MDA). Data are mean ± SD (n = 10). Ctr; negative control group, Veh; vehicle-treated PS-injected group, OA; oleanolic acid-treated PS-injected group, ANA; anagliptin-treated PS-injected group, Both; oleanolic acid and anagliptin-treated PS-injected group. a, P ≤ 0.05 compared with Ctr-group; b, P ≤ 0.05 compared with Veh-group; c, P ≤ 0.05 compared with OA-group; d, P ≤ 0.05 compared with ANA-group.
