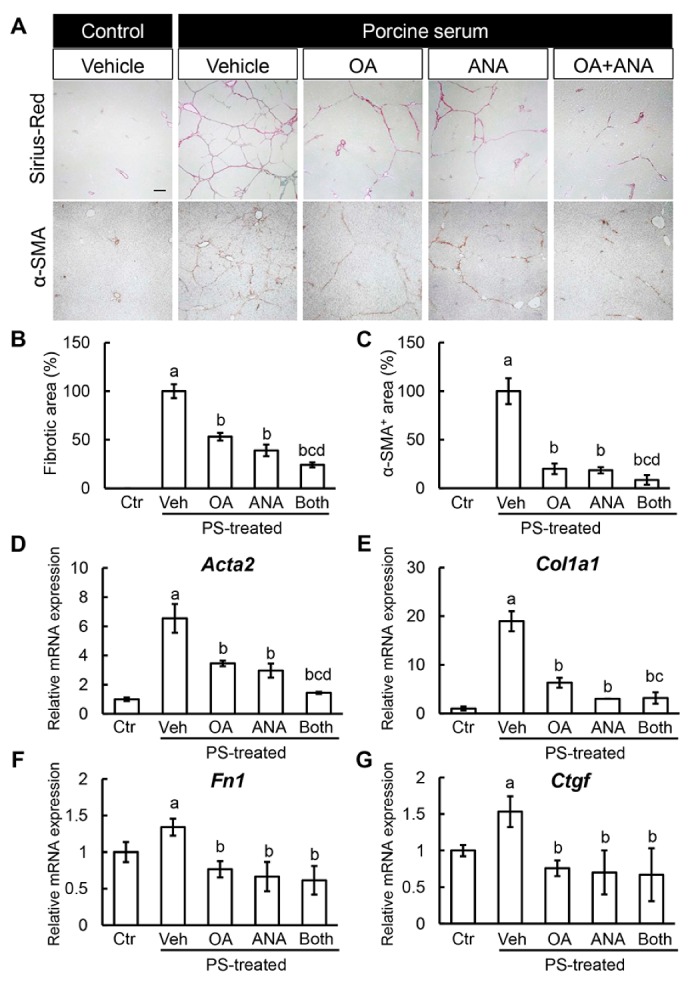
Figure 4.

In vivo effects of oleanolic acid and anagliptin on liver fibrosis. (A) Representative microphotographs of liver sections stained with sirius red and α-SMA. Scale bar; 50 μm. (B,C) Semi-quantitation of sirius red-stained fibrotic area (B: Ctr; 0 ± 0%, Veh; 100.0 ± 7.0%, OA; 53.2 ± 3.9%, ANA; 39.1 ± 5.9%, Both; 24.2 ± 2.6%), and α-SMA immune-positive area (C: Ctr; 0 ± 0%, Veh; 100.0 ± 13.3%, OA; 20.1 ± 5.4%, ANA; 18.6 ± 3.1%, Both; 8.6 ± 5.0%) in high-power field by NIH imageJ software. (D–G) Relative mRNA expression levels of fibrosis markers, Acta2 (D: Ctr; 1.00 ± 0.13, Veh; 6.54 ± 0.98, OA; 3.46 ± 0.19, ANA; 2.97 ± 0.48, Both; 1.44 ± 0.07), Col1a1 (E: Ctr; 1.00 ± 0.41, Veh; 18.97 ± 2.06, OA; 6.30 ± 1.03, ANA; 3.02 ± 0.03, Both; 3.17 ± 1.16), Fn1 (F: Ctr; 1.00 ± 0.14, Veh; 1.34 ± 0.12, OA; 0.77 ± 0.11, ANA; 0.66 ± 0.20, Both; 0.61 ± 0.19), and Ctgf (G: Ctr; 1.00 ± 0.07, Veh; 1.53 ± 0.21, OA; 0.76 ± 0.11, ANA; 0.70 ± 0.30, Both; 0.67 ± 0.36) in the liver of experimental mice. The mRNA expression levels were measured by quantitative RT-PCR (qRT-PCR), and Gapdh was used as internal control for qRT-PCR (D). Data are mean ± SD (n = 10). Ctr; negative control group, Veh; vehicle-treated PS-injected group, OA; oleanolic acid-treated PS-injected group, ANA; anagliptin-treated PS-injected group, Both; oleanolic acid and anagliptin-treated PS-injected group. a, P ≤ 0.05 compared with Ctr-group; b, P ≤ 0.05 compared with Veh-group; c, P ≤ 0.05 compared with OA-group; d, P ≤ 0.05 compared with ANA-group.
