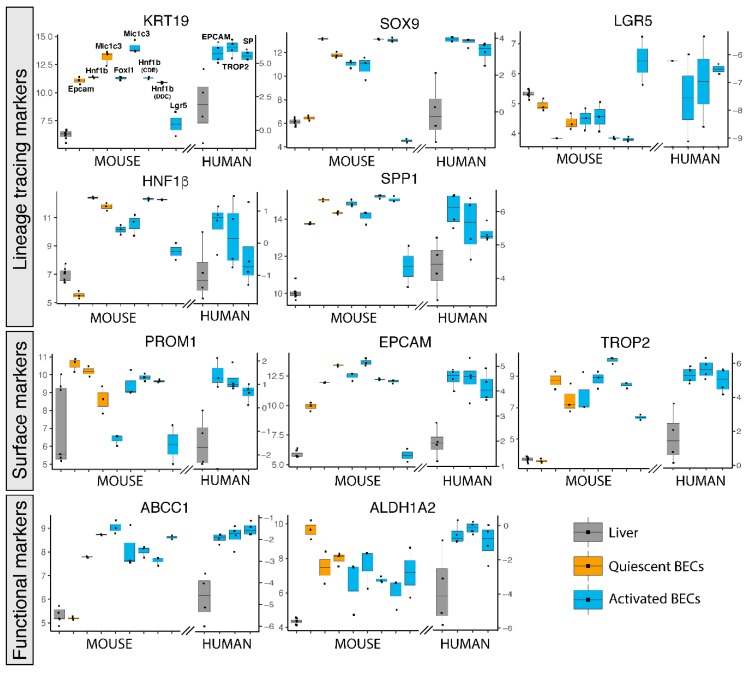
Figure 2.
Gene expression of popularly used BEC markers for isolation in primary human and mouse BECs. Gene expression of mouse and human livers (grey), quiescent (orange) and activated (blue) BECs. Left axis represents normalized intensity values (log2) for all mouse gene expression and right axis normalized transcript per million (log2) for human data.

