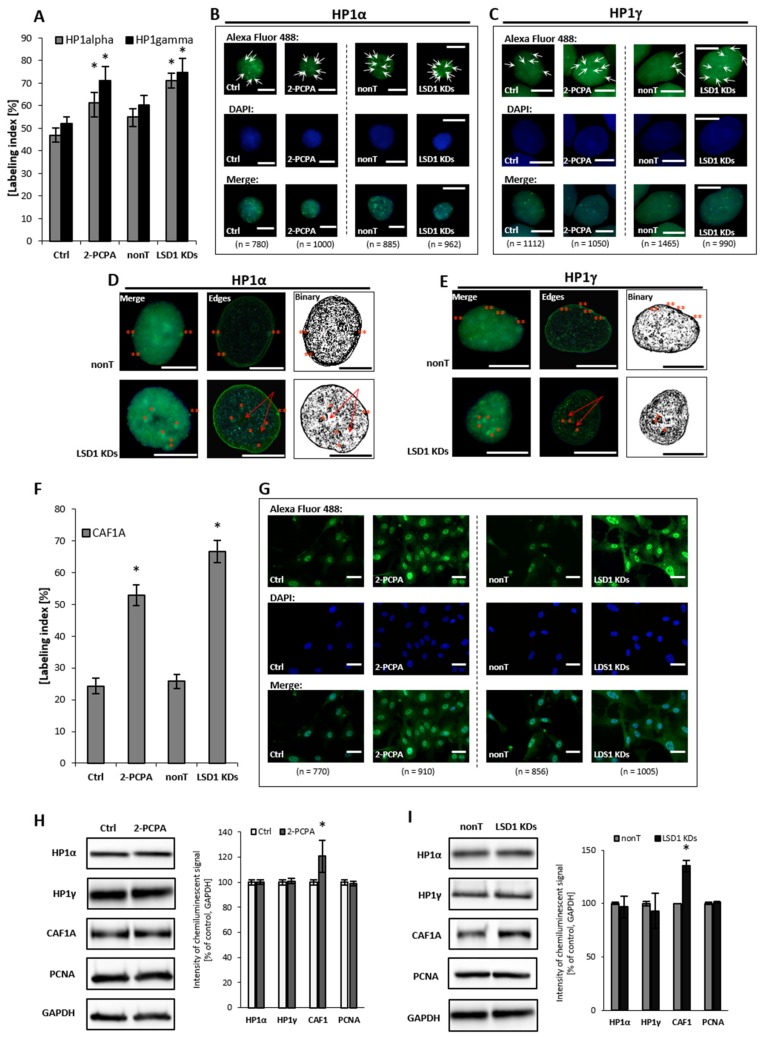
Figure 3.
Effect of pharmacological and transcriptional inhibition of lysine-specific demethylase 1 (LSD1) on the ‘topography’ of heterochromatin fraction. Immunofluorescent analysis of HP1 alpha and gamma localization (A–E) and CAF1A protein (F,G). The labeling index was calculated as the ratio of immunofluorescence-labeled cells to all cells in an HMEC-1 cell population. Subfigures D and E show exemplary nuclei from the series “not-treated” (nonT) versus “treated” (LSD1 KDs) for respectively: HP1 alpha protein and HP1 gamma, and enroll the most characteristic location of specific foci, labeling heterochromatin regions at the periphery of the interphase nuclei (double red star), which is usually associated with the nuclear lamina, and perinucleolar heterochromatin (single red star). The red arrows indicate the unlabeled region (the so-called “hole”) in the location of the nucleoli. The protein expression of HP1 aplha, HP1 gamma, and CAF1A by Western blotting in cells treated with 100 µM of 2-PCPA (H), and (I) shRNA-transfected HMEC-1. Presented images are representative, and the data are the average of three independent experiments. Scale bars are equal to 10 µm. * p < 0.05, ANOVA and post hoc analysis by Tukey’s test.

