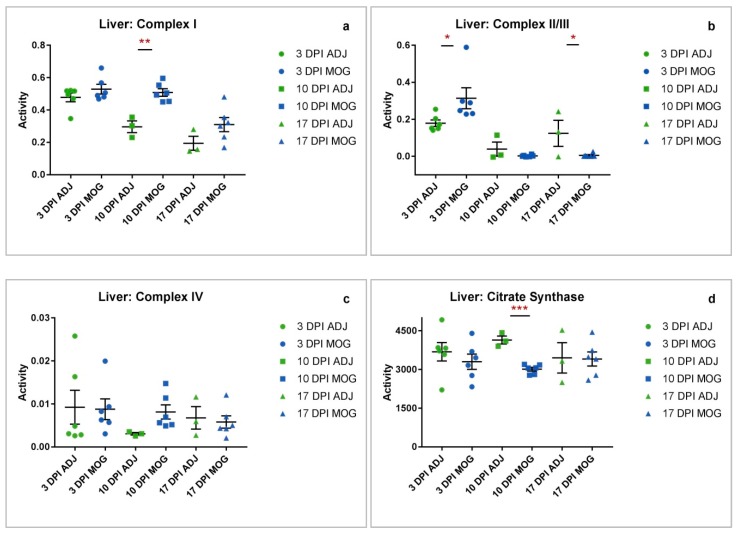
Figure 3.
Liver complex activity ADJ vs. MOG at different time-points. Individual raw data points for controls (ADJ) (green) and diseased (MOG) (red) have been plotted with mean and standard error of mean (SEM) to show the distribution of complex activity. Activities shown are expressed as a ratio to CS activity. (a) Graph showing distribution of complex I activity across ADJ and MOG. Complex I activity in MOG animals was significantly increased at 10 DPI (** p = 0.0014). (b) Complex II/III activity in MOG animals was significantly increased at 3 DPI (* p = 0.0456) and decreased at 17 DPI (* p = 0.0379). (c) Complex IV activity showed no significant differences between MOG and ADJ animals across all three time-points. (d) Liver mitochondrial enrichment was assessed by determination of CS activity, which showed a significant decrease in MOG animals at 10 DPI (*** p = 0.0001).

